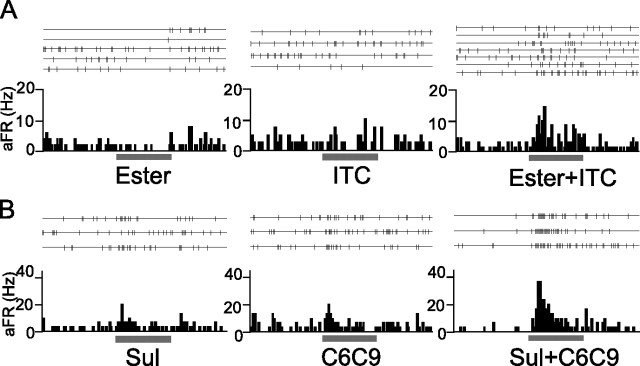
Figure 7.
Mixture facilitation of odor-evoked responses of aPC neurons. A, Spike traces and peristimulus time histogram of a neuron in the area of the aPC. This neuron (layer 2) showed small inhibitory responses to ester (left histogram) but showed no significant response to ITC (middle). When stimulated with the mixture of these categories, however, this neuron showed strong excitatory responses (right). B, Another aPC neuron (layer 3) showing only weak excitatory responses to Sul (left) and C6C9 (middle). This neuron showed a robust response when stimulated with the mixture of Sul and C6C9. aFR, Averaged firing rate. The bar under the histogram indicates the period of odor stimulation (3 s).

