
Figure 6.
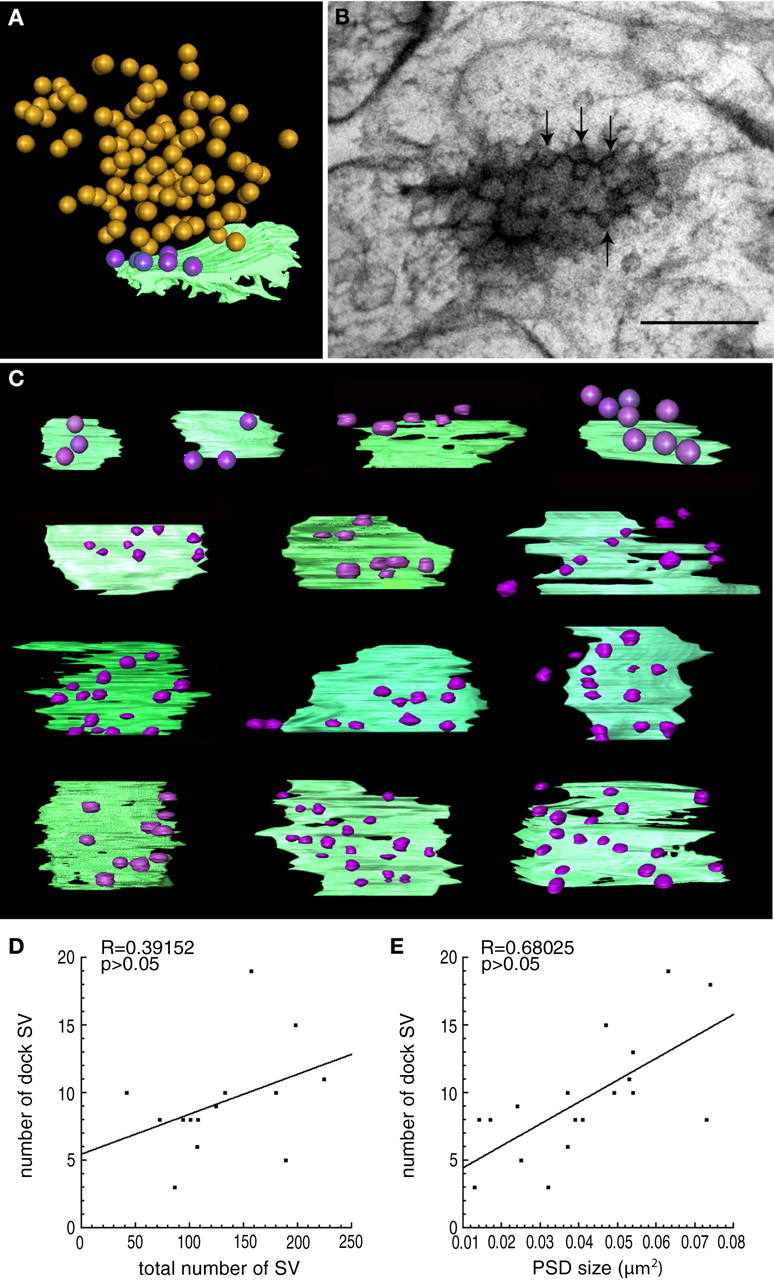
Distribution of the SVs. A, For 3D rendering, SVs were spotted on individual virtual sections constituting the tomogram. Docked SVs are in purple, and the other ones are in gold. The extension of the synaptic contact is defined by the PSD (green). B, En face view of a synapse from an ultrathin section. The docked SVs (arrows) are not homogeneously distributed at the AZ. C, 3D reconstructions from tomograms of the docked SVs in relation to the PSD. The synapses are ordered according to the number of docked SVs. D, Absence of correlation between the number of docked SVs and the total number of SVs analyzed in 14 synapses. E, Correlation between the number of docked SVs and the size of the PSD in 18 synapses. Scale bar, 200 nm.