Figure 1.
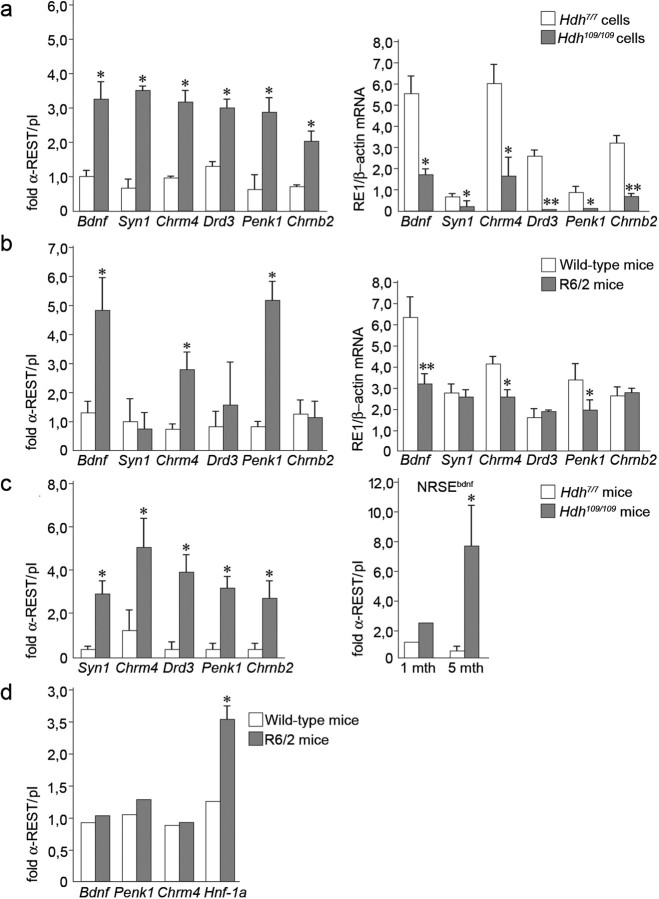
Endogenous REST/NRSF binding at RE1/NRSEs is increased in HD leading to repression of RE1/NRSE gene transcription. a, Left, ChIP analysis on six RE1/NRSE selected loci in neural cells established from homozygous (Hdh109/109) knock-in mice and wild-type littermates (Hdh7/7). Data represent the average of three different experiments. Right, mRNA levels of the same RE1/NRSE-controlled genes in Hdh7/7 and Hdh109/109 cells by real-time PCR. Data are the average of three different experiments. *p < 0.05; **p < 0.01 versus Hdh7/7; ANOVA test. b, Left, ChIP on cortical lysates from R6/2 transgenic mice at 12 weeks of age and corresponding littermates. Right, mRNA levels by real-time PCR of the same RE1/NRSE genes in R6/2 transgenics and controls at the same age. ChIP and mRNA data represent the average of five R6/2 transgenics and five controls. *p < 0.05; ** p < 0.01 versus littermates, ANOVA test. c, Left, ChIP for REST/NRSF on cortical lysates from Hdh109/109 at 5 months. Data represent the average of three Hdh109/109 and three Hdh7/7 mice. *p < 0.05 versus Hdh7/7 mice; ANOVA test. Right, REST/NRSF binding at the NRSEbdnf in Hdh109/109 at 1 and 5 months. Data are the average of three Hdh109/109 and three Hdh7/7 mice at 1–5 months. *p < 0.05 versus Hdh7/7 mice; ANOVA test. d, ChIP for REST/NRSF on liver lysates from three R6/2 mice and three controls at 12 weeks of age. *p < 0.05 versus wild-type mice; ANOVA test.

