
Figure 1.
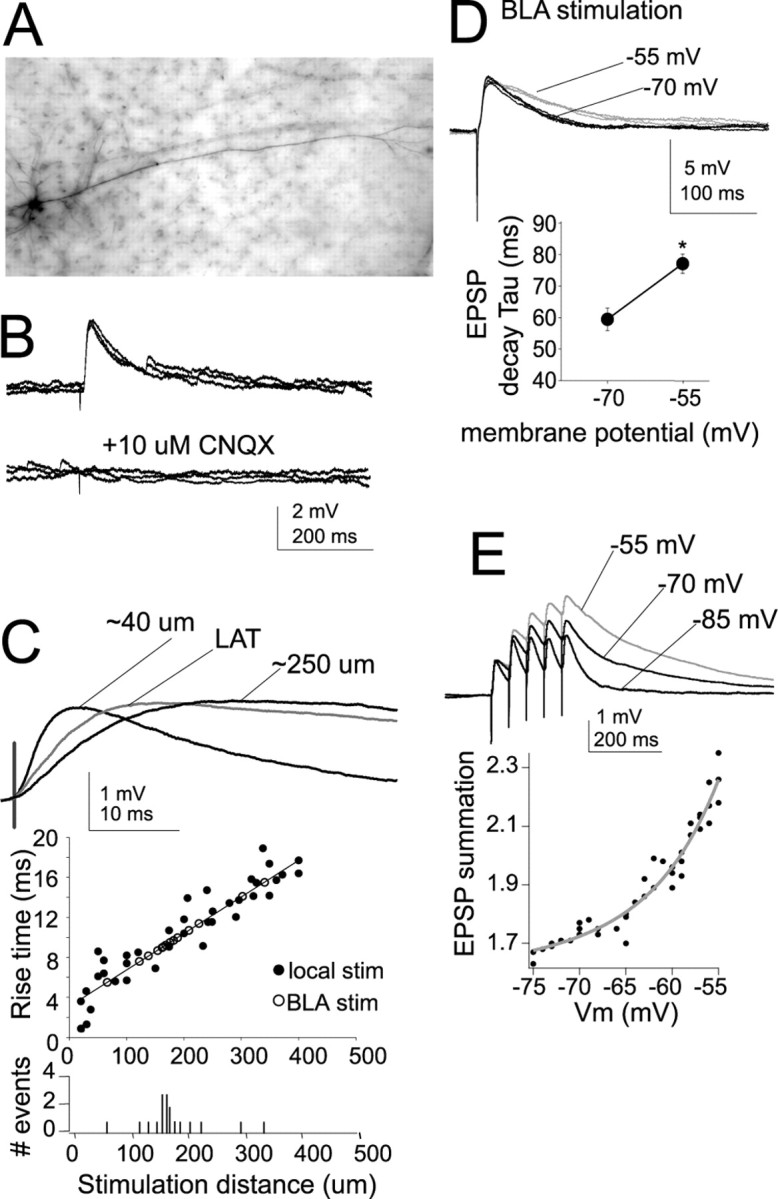
Characteristics of EPSPs. A, Example of a neurobiotin-filled layer V pyramidal neuron recorded in lateral EC. B, Stimulation of the LAT or local stimulation close to the apical dendrite of layer V EC neurons evokes an EPSP in the presence of blockers of NMDA, GABAA, and GABAB receptors. The remaining component of this EPSP is entirely blocked by 10 μm CNQX, an AMPA/kainate receptor blocker. For maximal clarity, in all panels, examples of LAT or local stimulation are shown, unless indicated otherwise. C, Traces show an EPSP evoked by stimulating electrodes ∼40 and 250 μm from the soma and an EPSP evoked by LAT stimulation (stim; average of 5 traces). The rise time of EPSPs is a rough index of the distance of a synapse from the recording electrode at the soma. The rise time of the locally evoked EPSPs is plotted as a function of distance of the stimulation electrode from the soma. By plotting the rise times of EPSPs evoked by LAT stimulation along the regression constructed from locally evoked EPSPs, one can derive a rough estimate of the distance of the LAT inputs from the soma. The histogram plots the number of LAT-evoked events as a function of their extrapolated input distance. The majority of LAT inputs display rise times that correspond to EPSPs evoked by local stimulation at 150–200 μm from the soma. D, The decay time of EPSPs was strongly voltage dependent, with a slower decay time constant observed at depolarized membrane potentials (gray). Three overlayed traces at each voltage are displayed. E, A consequence of this slower decay time was increased summation of EPSPs at depolarized membrane potentials (traces displayed are averages of 5 sweeps). Membrane potentials of −70 and −55 mV were chosen for statistical comparison. *p < 0.05, significant difference in a paired t test comparison between the two membrane potentials.