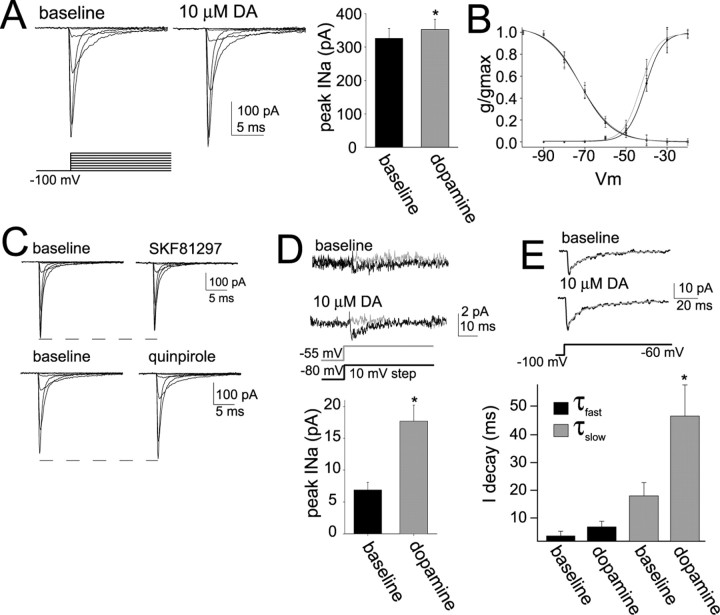
Figure 5.
DA modulates Na+ current measured from nucleated patches. A, Application of DA caused a small increase in the peak INa. B, DA (gray) caused a leftward shift in the voltage of activation of INa, without a significant change in the inactivation. C, The effects of DA were mimicked by a D2 agonist quinpirole (10 μm). A D1 agonist, SKF81297 (10 μm), exerted the opposite effect, decreasing Na+ currents. D, To test whether INa was modulated within the limited voltage ranges examined in current-clamp recordings (above), INa was evoked with a 10 mV step to −55 mV, grossly mimicking the depolarization evoked by summation of EPSPs at depolarized membrane potentials. The peak amplitude of this INa was greatly enhanced by DA. Overlayed are averaged traces of the current evoked by a 10 mV step to −55 mV (black) and to −80 mV (gray) for comparison. E, DA also prolonged the decay time of a Na+ current evoked by a voltage step from −100 mV to approximately −60 mV. All INa traces depicted are averages of 5–10 sweeps. *p < 0.05, significant difference in a paired t test comparison between baseline and DA conditions.

