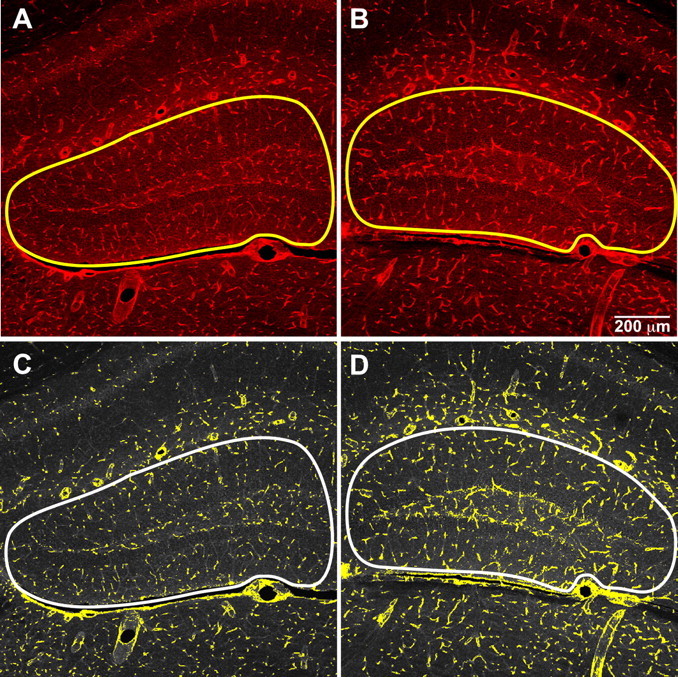
Figure 4.

Vasculature in the DG of mice that consumed control or (−)epicatechin diet. Lectin-stained vessels (red) were quantified using imaging software to assign a pseudocolor mask (yellow) to highlight the threshold for brightness and luma. There was a significant increase in vasculature in the DG of flavanol-treated mice (B, D) compared with controls (A, C). The outline of the analyzed area is marked in all panels and includes the DG and molecular layer.
