Figure 5.
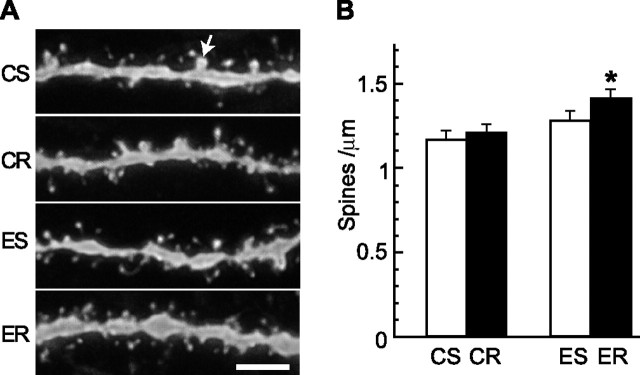
DiI labeling of DG granule cells in mice that received control or (−)epicatechin diet under sedentary or running conditions for 6 weeks. A, Representative images of DiI-labeled dendritic fragments in the outer molecular layer of the DG in CS, CR, ES, and ER mice. The arrow indicates a mushroom spine of which the estimated surface area is no less than 0.4 μm2. Scale bar, 5 μm. B, Spine-density quantification showed that neurons from ER mice had more spines than cells from CS (*p < 0.014) or CR (*p < 0.03) animals. Error bars indicate SEM.

