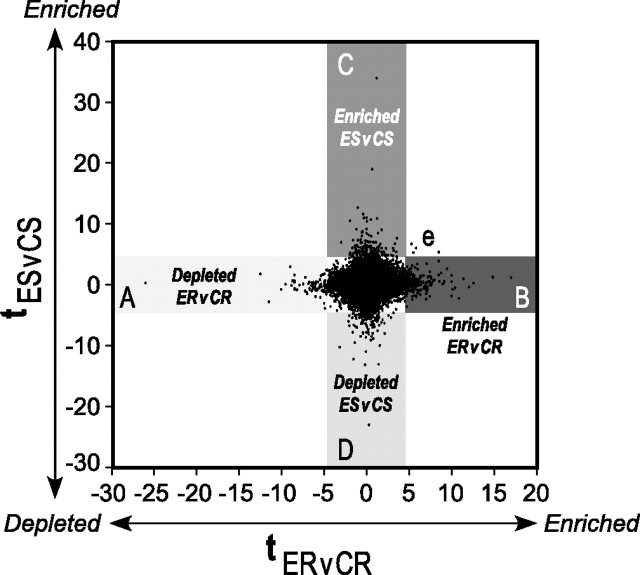
Figure 6.
Two-dimensional representation of gene expression changes resulting from 6 weeks of daily (−)epicatechin consumption with or without running. t statistics and cutoffs (p < 0.005) for ER versus CR (ERvCR; x-axis) and ES versus CS (ESvCS; y-axis) mice were computed as described in Materials and Methods. Each (x, y) point in the graph represents the t statistic (tER,CR, tES,CS) for a probe set. A–D, Specifically, genes that are depleted (A) or enriched (B) in ER are shown in the horizontal axis; enriched (C) or depleted (D) gene expression with (−)epicatechin alone (ES) is represented in the vertical axis. e, Four genes that are uniquely enriched in both sedentary and running flavanol-treated mice.

