
Figure 6.
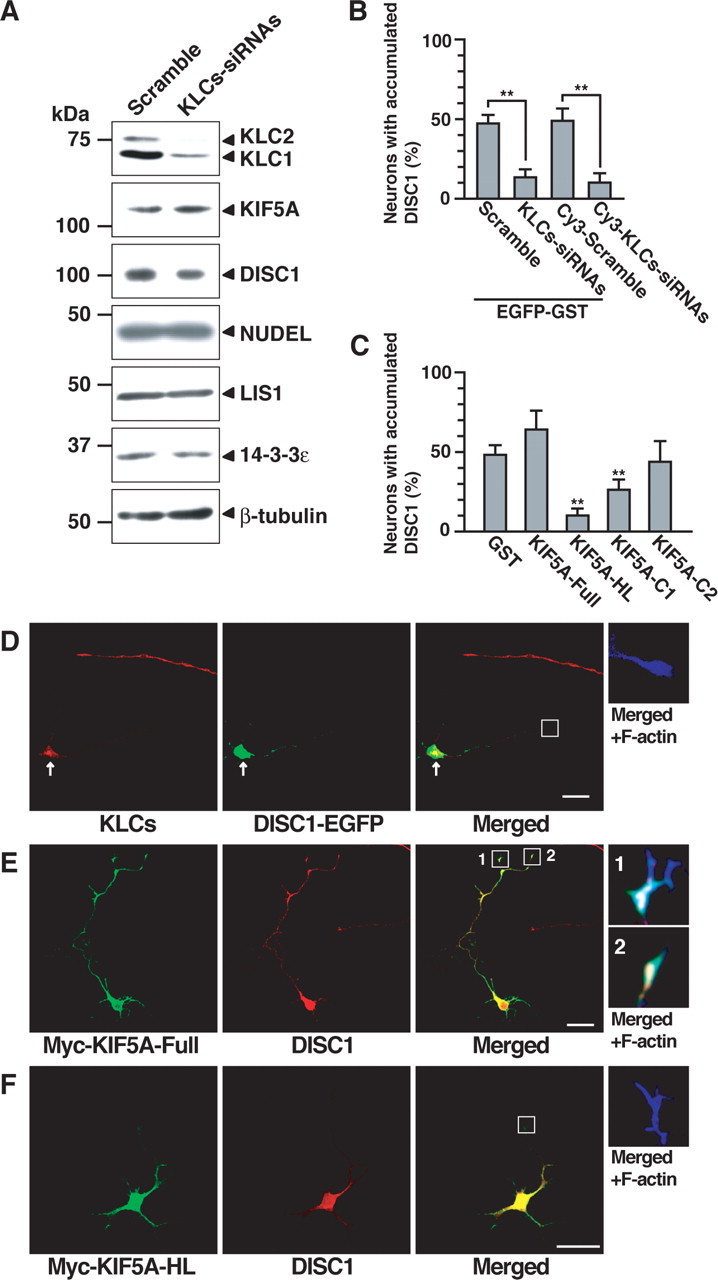
Effect of KLCs knockdown and dominant-negative form of KIF5A on accumulation of DISC1 in the distal part of the axon. A, PC12 cells were transfected with scramble or KLCs–siRNAs and then differentiated with NGF for 48 h. Lysates were analyzed by immunoblotting with antibodies against the indicated proteins. B, Hippocampal neurons transfected with expression plasmid encoding EGFP–GST and scramble or KLCs–siRNAs at DIV1 were detected by EGFP fluorescence and staining of DISC1 and F-actin at DIV3. Hippocampal neurons transfected with Cy3-labeled scramble or KLCs–siRNAs were detected by Cy3 fluorescence and staining of DISC1 and F-actin. Axons of transfected neurons were scored using a percentage of the numbers of accumulated DISC1 in the distal part of the axon. More than 90% of the cells transfected with EGFP–GST and KLCs–siRNAs or Cy3–KLCs–siRNAs showed the decreased immunoreactivity of KLCs. C, Neurons transfected with Myc–GST or Myc–KIF5A mutants were identified by Myc staining and were scored using a percentage of the numbers of accumulated DISC1 in the distal parts of axons. B, C, Numbers of cells used for each calculation are >50, and the values shown are means ±SE of three independent experiments (Student's t test, **p<0.01).D, Hippocampal neurons transfected with KLCs-siRNAs and expression plasmid encoding DISC1-EGFP are shown by EGFP fluorescence and staining of KLCs (red) and F-actin (blue). Arrows indicate KLCs-knockdown neurons. E, F, Hippocampal neurons transfected with expression plasmid encoding Myc-KIF5A-Full (E) or Myc-KIF5A-HL (F) are shown by staining of Myc (green), DISC1 (red), and F-actin (blue). D-F, Enlarged images of the axonal growth cones are shown. Scale bars, 20 μm.