

Abstract
Research investigating the pathophysiology of Parkinson's disease (PD) mostly focuses on basal ganglia dysfunction. However, the main output from the basal ganglia is via the thalamus, and corticothalamic feedback constitutes the primary source of synapses in the thalamus. We therefore focus on the thalamocortical interplay. During the surgical intervention in six patients, local field potentials (LFPs) were recorded from pallidal-recipient thalamic nuclei VA and VLa. Simultaneously, EEG was recorded from several sites on the scalp. The highest thalamocortical coherence was found in the theta frequency band (4–9 Hz) with a mean peak frequency of 7.5 Hz. The magnitude of thalamocortical theta coherence was comparable to the magnitude of EEG coherence between scalp electrode pairs. Thalamocortical theta coherence reached 70% and was maximal with frontal scalp sites on both hemispheres. In the 13–20 Hz β frequency band, maximal coherence was comparatively low but localized on the scalp ipsilateral to the site of thalamic LFP recording. The high thalamocortical coherence underlines the importance of thalamic function for the genesis of scalp EEG. We discuss the PD pathophysiology within the framework of dysrhythmic thalamocortical interplay, which has important consequences for the choice of therapeutic strategy in patients with severe forms of PD.
Keywords: EEG, LFP, thalamocortical dysrhythmia, thalamus, cortex, thalamocortical system
Introduction
According to the established pathophysiological concept of Parkinson's disease (PD), the loss of dopaminergic projections from the substantia nigra to the striatum leads to changes in basal ganglia activity (Lozano et al., 1998). The main output from the basal ganglia complex is via the pallido-thalamic tract to the thalamus. Pathological hyperactivity of the internal globus pallidus leads to excessive inhibition of the pallidal-recipient thalamus (Jeanmonod et al., 1996; Magnin et al., 2000; Anderson et al., 2003). However, it is known that corticothalamic feedback constitutes the primary source of synapses in the thalamus, one order of magnitude larger than synapses from peripheral axons (Van Horn et al., 2000). Based on the conceptual foundations laid by Llinas (Llinas, 1984; Llinas and Pare, 1994; Llinas et al., 1998, 1999; Llinas and Steriade, 2006), we therefore focus our clinical and research efforts on the thalamocortical interplay.
With the growing number of stereotactic operations against movement disorders, the interest has grown to record local field potentials (LFP) from subcortical brain regions in humans. LFP recordings come mainly from sites in the cerebellar thalamus (Marsden et al., 2000; Paradiso et al., 2004) or in the basal ganglia (Marsden et al., 2001; Williams et al., 2002; Fogelson et al., 2006) and reflect the sites of surgical intervention.
Here, we present LFP from the pallidal-recipient thalamic nuclei VA and VLa. These nuclei receive projections from the pallido-thalamic tract and are thus affected by the PD pathophysiology. We recorded data from six PD patients during therapeutic intervention (Magnin et al., 2001). The simultaneous recording of scalp EEG with several electrodes allows investigation of both the strength and the topography of the thalamocortical interaction. In our previous work on a heterogeneous group of neurological patients (Sarnthein et al., 2003), data from patients with PD were not investigated in detail. We now report high thalamocortical coherence of ∼7 Hz, which was comparable in magnitude to EEG coherence between scalp electrodes. This finding suggests that thalamic and cortical factors are both relevantly contributing to the cortical rhythmicity recorded by scalp EEG (Nunez et al., 2001; Schreckenberger et al., 2004). The pathophysiological effects of PD on the thalamus thus lead to a slowing of scalp EEG in PD patients (Soikkeli et al., 1991; Stanzione et al., 1996; Tanaka et al., 2000). Our results support the notion that the PD symptomatology originates from a disturbance in the thalamocortical interplay (Llinas, 1984; Volkmann et al., 1992, 1996; Llinas and Pare, 1994; Jeanmonod et al., 1996; Llinas et al., 1999).
Materials and Methods
Patients.
We analyzed spontaneous brain activity intraoperatively from six patients suffering from severe PD, all displaying resistance to classically recognized drug treatments. Medication during surgery was aimed at optimal tremor control during recording. The surgical procedure of pallidothalamic tractotomy has been described previously (Magnin et al., 2001). All patients were fully informed about the risks and benefits of the procedure and gave informed consent. Local anesthesia was applied on the frame fixation points and the penetration point. Three milligrams of the anxiolytic drug bromazepam were given 4–5 h before recording, which neither made patients drowsy nor significantly affected their symptomatology at the moment of recording.
LFP and EEG recordings.
Thalamic LFP was recorded in the border region between nuclei VA and VLa in the pallidal-recipient thalamus. The recording site ∼8 cm below the scalp was reconstructed with postoperative magnetic resonance imaging on a stereotactic atlas of the human thalamus (Morel et al., 1997). Along the penetration in the thalamus, microelectrode activity was recorded at several sites to verify the localization of the therapeutic target. The tungsten microelectrode (FHC, Bowdoinham, ME) had a final taper angle of 10–20° and a tip diameter <1 μm. The epoxylite insulation was removed by electrolysis along 20–50 μm, and the tip was then plated with gold and platinum to obtain an impedance of <100 kΩ at 1000 Hz. This microelectrode was used to record both LFP and single-unit activity (Jeanmonod et al., 1996; Magnin et al., 2000). For LFP recordings, the uninsulated rim of the stainless steel guiding cannula served as reference. The reference was located 13 mm above the microelectrode tip at the border of the capsula and the caudate nucleus. The microelectrode and the stainless steel reference produced a battery potential exceeding 0.5 V, which was eliminated with symmetric AC decoupling by capacitors on both the active and reference channels (10 nF; amplifier Rin = 10 MΩ; high-pass cutoff, 1.6 Hz). Electrode sites on the scalp were selected from the international 10–20 system to be compatible with the surgical procedure (patients 1, 2, and 3: 6 sites; patients 4, 5, and 6: 15 sites). EEG was recorded with sintered Ag/AgCl electrodes (Falk Minow Services, Herrsching, Germany) against Cz as common reference. All signals were registered with a SynAmps EEG system (Neuroscan Compumedics, Houston, TX) (16 bit A/D conversion; sampling rate, 20 kHz; 0.3–3000 Hz bandpass filter; −12 dB/octave) and continuously viewed on a personal computer monitor. Recording lasted >1 min. During recording, patients were awake and had their eyes closed to reduce eye-movement artifacts and to focus on resting brain activity.
Data preprocessing.
The data were analyzed off-line in the Matlab (The Mathworks, Natick, MA) environment using EEGLAB [ http://sccn.ucsd.edu/eeglab (Delorme and Makeig, 2004)] and custom programming on the basis of standard mathematical and signal analysis functions. Signals were first resampled to 500 Hz for the analysis of thalamic LFP and scalp EEG. The scalp EEG was re-referenced to the mean of the signals recorded at the ear lobes. We confirmed the alertness of subjects during the recording session by checking for slow rolling-eye movements. The data were inspected in 5 s epochs, and large muscle or eye-movement artifacts were removed. For editing purposes, muscle artifacts were considered significant if the underlying EEG rhythms were not clearly seen. This procedure resulted in >60 s of EEG for spectral estimates.
Spectral analysis.
The spectral analysis was performed with the multitaper method, which offers optimal spectral smoothing (i.e., it allows to trade resolution in the frequency domain for reduced variance; http://www.chronux.org) (Mitra and Pesaran, 1999). Spectra were calculated with a window length of 4 s, fast Fourier transform length of 8 s, and bandwidth parameter nw = 4 and k = 3 tapers (see Fig. 1). Spectral peaks were determined, and the peak position was classified with respect to the frequency bands: δ, 1–4 Hz; theta, 4–9 Hz; α, 9–13 Hz; β, 13–20 Hz.
Figure 1.

Spectral analysis of EEG and LFP. A, B, Power spectral density (units 10*log10 μV2 Hz−1) of scalp EEG at site C3 (A) and thalamic LFP (B) in patient 3. C, The coherence between EEG and LFP is significant from 7 to 9 Hz (full-width at half-maximum = 1.5 Hz) in the theta band. The 95% confidence interval (black ribbon) indicates significantly non-zero coherence also around 16 Hz in the β band. D, Phase ϕ between EEG and LFP. The slope dϕ/df was transformed into latency.
Coherence.
The magnitude squared coherence MSCxy for two signals, x and y, is equal to the average cross-power spectrum Pxy normalized by the averaged power spectra of the signals MSCxy = |Pxy|2/(PxxPyy). The 95% confidence interval for the coherence estimate was calculated using jackknife statistics and is given as a black ribbon in Figure 1C. Coherence assesses the strength of the linear relationship between two signals at every frequency f, and its value lies between 0 and 100%. It estimates the degree to which phases and amplitudes are dispersed at the frequency of interest. MSCxy = 0 means phases and amplitudes are randomly dispersed among all epochs. Signals are perfectly coherent (MSCxy = 100%) at a given frequency when they have both a constant phase difference ϕ and constant amplitude ratio over the time considered. In this case, phases of signals x and y are identical in all epochs (i.e., the two signals are completely phase-locked at this frequency).
Latency.
The latency Lxy between LFP and EEG signals was estimated from the phase difference ϕ plotted in Figure 1 D. We chose a range of frequency points where coherence was significant, fitted a straight regression line to the slope of the phase spectrum dϕ/df, and calculated the latency according to Lxy = dϕ/df/2π (Gotman, 1983). The 95% confidence limits for the latency were derived from the confidence limits of the slope.
Results
Power spectral density
The EEG spectrum of patient 3 during surgery is shown in Figure 1 A. The most obvious characteristic in the EEG spectra of this and all other patients (Table 1) was the presence of a dominant theta peak in the scalp EEG recordings. The α peak commonly found in healthy subjects (Nunez et al., 2001) was reduced or not present. The peak frequencies in the patients were below the slowed EEG peak frequency expected from normal aging. The slowing of scalp EEG or magnetoencephalogram (MEG) in patients with PD has also been reported by other groups (Soikkeli et al., 1991; Llinas et al., 1999; Tanaka et al., 2000; Salenius et al., 2002). For comparison, the LFP spectrum in Figure 1 B also showed a visible theta peak but differed from scalp EEG spectra at other frequencies.
Table 1.
Patient characteristics and spectral peaks
| Patient | Sex | Age | PTT side | EEG power peak (Hz) |
LFP power peak (Hz) |
Thalamocortical theta coherence peak |
Thalamocortical β coherence peak |
|||||
|---|---|---|---|---|---|---|---|---|---|---|---|---|
| Height (%) | Frequency (Hz) | FWHM (Hz) | Height (%) | Frequency (Hz) | FWHM (Hz) | Site | ||||||
| 1 | M | 85 | Left | 8.0 | 7.7 | 42 | 8.0 | 3.2 | 5 | 16 | 0.8 | C3 |
| 2 | M | 65 | Right | 7.0 | 7.9 | 52 | 6.8 | 0.8 | 8 | 18 | 2.7 | C4 |
| 3 | M | 76 | Left | 8.0 | 8.0 | 73 | 8.3 | 1.5 | 14 | 17 | 1.9 | C3 |
| 4 | F | 64 | Right | 6.5 | 6.4 | 56 | 6.0 | 2.1 | 11 | 15 | 2.1 | C4 |
| 5 | M | 71 | Right | 8.5 | 8.5 | 60 | 8.3 | 1.8 | 15 | 15 | 0.9 | C4 |
| 6 | M | 62 | Left | 7.0 | 6.0 | 65 | 7.5 | 1.5 | 14 | 13 | 1.2 | C3 |
The laterality of the surgical intervention pallidothalamic tractotomy (PTT) determines the site of recording in left or right thalamic nuclei VA/VLa. For the EEG and LFP power spectra, the position of the dominant peak is given in hertz. Significant peaks of the thalamocortical coherence were found in the 4–9 Hz theta and in 13–20 Hz β frequency bands. The site of enhanced β coherence was ipsilateral to the site of thalamic recording for all patients. FWHM, Full-width at half-maximum; M, male; F, female.
Coherence
The maximal coherences between EEG and LFP (Fig. 1C) were found in the theta band in all patients (Table 1). Figure 2 A sets thalamocortical coherence in relation to coherence between scalp electrode pairs. Maximal scalp–scalp theta coherences (+) are plotted for all patients and all electrode pairs containing the foremost electrode (FPz or AFz). The electrode spacing in the pair is given in units of head radius. Coherence falls off with distance, as expected (Nunez et al., 2001). Thalamocortical coherence (o) does not show the dependence on distance, but maximal values are comparable with those on the scalp.
Figure 2.

Theta coherence maxima and thalamocortical latencies. A, Plotted are the maximal coherence values in the 4–9 Hz theta band of all electrode pairs containing the thalamic site (○) or the most frontal scalp site (+, Fpz or AFz) from all patients. The abscissa denotes the distance between the electrode sites of each pair. The corticocortical coherence falls off with distance. The thalamocortical coherence reaches high values for frontal electrode sites (markers ○ and + overlaid). B, The spread of thalamocortical latencies is of the same order of magnitude as the period T = 125 ms of the 8 Hz wave (interval between dotted lines).
The highest thalamocortical coherence values in the theta band were found with frontal electrode sites. This is illustrated in Figure 3, where the median coherences of the patient group are plotted topographically. Over the entire patient group, the median coherence was 54% to anterior electrode sites (FPz, AF7, AF3, AFz, AF4, AF8) and 30% to posterior sites (T7, C3, Cz, C4, T8, CPz, P3, Pz, P4). The two medians are different with p < 0.03 (paired-samples Wilcoxon test). Regardless of whether the recording site was in the left or right thalamus, no lateral dominance could be found (paired-samples Wilcoxon test), and the scalp topography of theta coherence maxima was similar in all patients.
Figure 3.
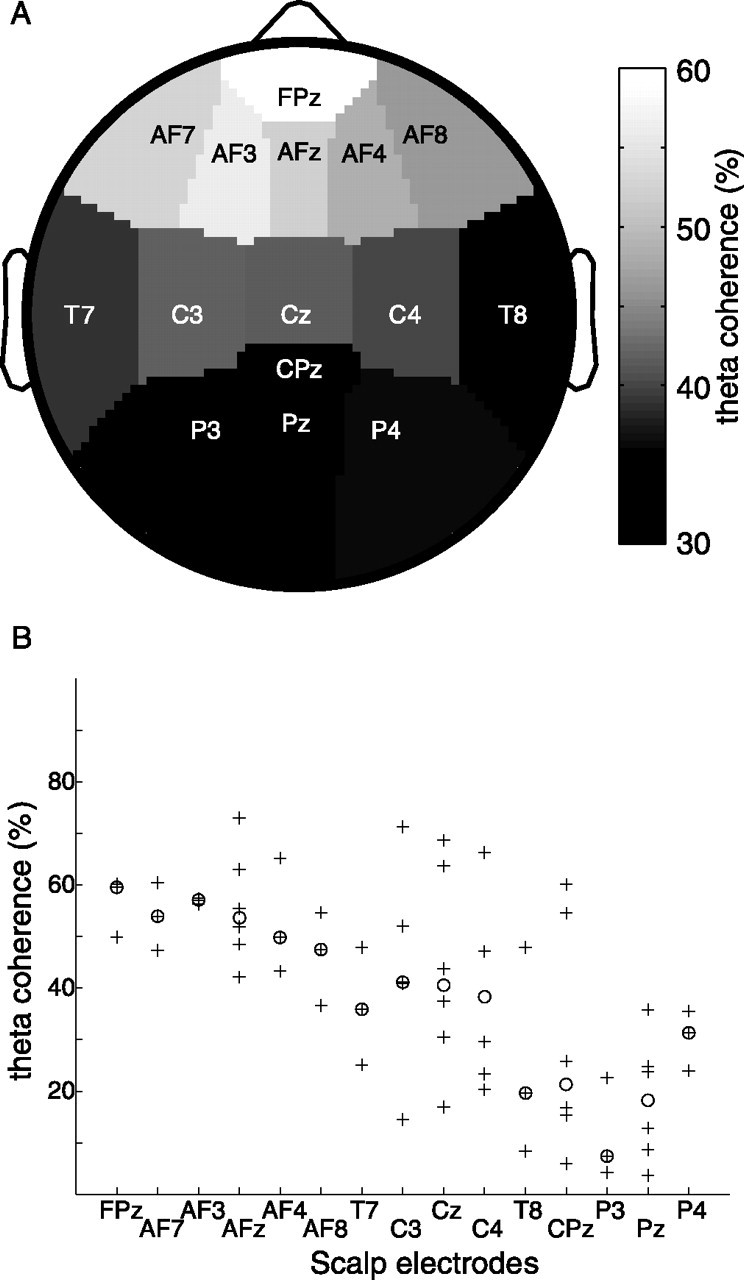
Theta coherence is maximal to frontal sites. A, For the patient group, the medians of thalamocortical theta coherence maxima are plotted on the topography of the scalp EEG sites. The frontal maximum reflects the finding that thalamocortical coherence was maximal with frontal sites for all patients. B, The medians (○) in A are plotted together with all corresponding coherence maxima (+).
Significant coherence between thalamic LFP and scalp EEG also appeared in the β band. For example, in Figure 1C the black ribbon representing the 95% confidence interval rises above zero around 16 Hz. To assess the scalp topography of thalamocortical β coherence, patients were divided in two subgroups according to the laterality of the thalamic LFP recording. Figure 4 shows the median coherences for each patient subgroup. Coherence was maximal with left central scalp sites (Fig. 4A,B) and right central scalp sites (Fig. 4C,D). Among the scalp electrodes over the motor cortex (C3 and C4), thalamocortical coherence was larger with the electrode site over the ipsilateral motor cortex for all patients (Table 1), indicating significant ipsilaterality (Wilcoxon signed rank test, p < 0.05).
Figure 4.
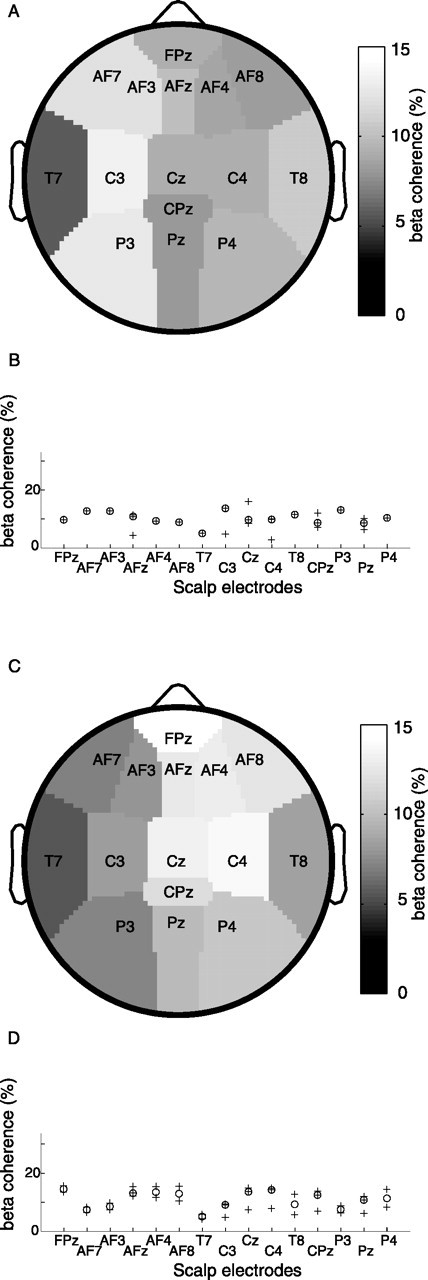
β Coherence is lateralized. The medians of thalamocortical β coherence maxima are plotted on the topography of the scalp EEG sites. Coherences in the β band are lower than in the theta band. A, The patient subgroup with LFP recording in the left thalamus shows maximal coherence with left central sites. B, The medians (○) in A are plotted together with all corresponding coherence maxima (+). C, The patient subgroup with LFP recording in the right thalamus shows maximal coherence with right central sites. D, The medians (○) in C are plotted together with all corresponding coherence maxima (+).
Thalamocortical latency in theta
Because we calculate the latency Lxy from the slope of the phase spectrum, then Lxy describes the time needed for wave packets to propagate between the two recording sites at group speed (Gotman, 1983). This latter approach relies on the implicit assumption that information flow within thalamocortical loops is mediated by propagating wave packets. The latency Lxy depends more on the oscillatory properties of the thalamocortical loop than on the axonal transmission delays. In our recordings (Fig. 2 B), absolute latency values were of the same order of magnitude as the 125 ms period of the 8 Hz oscillation in the theta frequency band. While a positive sign of Lxy indicates that cortical EEG leads over thalamic LFP in the information transfer, neither positive nor negative signs prevailed and the mean latency (18 ± 66 ms) was not significantly different from zero. This suggests that the thalamus and cortex are equivalent partners in thalamocortical interplay.
Discussion
Thalamocortical interplay
Scalp EEG and thalamic LFP, the two signals presented in this study, are generated by neural networks of drastically different scales. The scalp EEG is generated by dipole-like dendrites of cortical pyramidal cells arranged in parallel and space averaged over several square centimeters of the cortex (Nunez et al., 2001). In the thalamus, ellipsoid dendritic arbors of thalamocortical cells generate a “closed field” in the sense that there is no aligned structure of dipoles as in the cortex. For the LFP recorded from our electrode, we assume a contribution of cells in a cube of side length 100 μm (Engel et al., 1990), which corresponds to a sample of approximately four to five cells (Mai et al., 1997; A. Morel, personal communication). Because multielectrode LFP recordings in the thalamus show high correlation between distant sites (Contreras et al., 1996), even a small sample of cells may be representative for thalamic LFP activity.
The magnitude of thalamocortical theta coherence is comparable to the magnitude of coherence between EEG electrodes (Fig. 2A). This is much larger than the magnitude of coherence between subdural recordings, which amounts to only 20% at 3 cm and decreases with distance (Bullock et al., 1995). For the same distance, coherence in scalp EEG exceeds 80% (Fig. 2A, adjacent electrodes). Thus, the spatial averaging, which is at the basis of the EEG, may extract those components of cortical activity that are highly coherent over large distances (Nunez et al., 2001). Our finding of high thalamocortical coherence supports the notion that the thalamus is involved in synchronizing activity between distant cortical areas. This agrees with the anatomy of the thalamocortical network that is characterized by widely divergent thalamocortical and corticothalamic connections. In this way, a very focal thalamic activity as reflected in the LFP can show high coherence with widespread cortical areas. Our data also indicates that the two electrode types, microelectrode and scalp EEG electrode, are well adapted to record manifestations of the thalamocortical network interaction at the two given sites. The comparable magnitude of thalamocortical and EEG coherence, together with the symmetric spread of latencies, suggests that the thalamus and cortex are both relevant partners in the genesis of thalamocortical rhythmicity.
The strength of the thalamocortical coupling allows to consider thalamocortical modules as functional units in brain function. Because high thalamocortical correlation is also observed experimentally in healthy brains (Lopes da Silva et al., 1973; Schürmann et al., 2000; Schreckenberger et al., 2004), it can be assumed that the concept of thalamocortical modules (Llinas et al., 1998, 1999; Destexhe, 2000) is also valid in healthy human subjects. Nevertheless, the differences between LFP and EEG spectra underline that scalp EEG is not simply driven by the thalamus but depends also on cortical influences.
Could volume conduction between LFP and EEG electrodes account for the high coherence between the signals (Wennberg and Lozano, 2003)? Against this possibility speak (1) the marked frequency dependence of coherence in Figure 1, (2) the inhomogeneous topographical distribution of coherence in Figure 3A, and (3) the variability of coherence values between subjects in Figure 3B. This is evidence that thalamocortical coherence is mediated functionally through axonal projections.
For thalamocortical theta coherence, the scalp topography was found to be maximal with frontal EEG electrodes (Fig. 3). The LFP was recorded in the thalamic nuclei VA and VLa, which are part of the pallidal-recipient thalamus (Morel et al., 1997). The nuclei VA and VLa project to the premotor and prefontal cortices (Rouiller et al., 1999). This is evidence that thalamocortical coherence, a physiological measure, is related to the anatomical distribution of thalamocortical pathways. Maximal theta coherence was not strictly ipsilateral, thus suggesting that the oscillatory activity between the thalamus and cortex may not be confined to monosynaptic hemispheric projections.
In the β band, we found dominant coherence with ipsilateral central EEG electrodes (Fig. 4, Table 1). This coherence may be mediated monosynaptically by the afferents from nucleus VLa to motor, premotor, and supplementary motor areas (Morel et al., 2005). The magnitude of β coherence, however, was below 16% and thereby much lower than in the theta band. Values of similar magnitude were reported for β coherence between scalp EEG and recording sites in the cerebellar thalamus (Marsden et al., 2000; Paradiso et al., 2004) and basal ganglia (Marsden et al., 2001; Williams et al., 2002; Fogelson et al., 2006), indicating that activity at these sites also interacts with cortical activity. Anatomically and functionally, the main output of the basal ganglia occurs via the pallidothalamic and nigrothalamic tract to the thalamus. If the magnitude of coherence is taken to indicate the strength of the functional coupling, β band coherence may appear as a secondary effect in the mechanism of PD pathophysiology.
Mechanism of PD symptoms
The pathophysiology underlying PD is initiated by the loss of dopaminergic neurons in the substantia nigra (Lozano et al., 1998). We integrate the treatment of PD in the context of a pathophysiological framework globally described as thalamocortical dysrhythmia (TCD) (Llinas et al., 1998, 1999). The following sequential set of events (Fig. 5) was proposed to explain how thalamic overinhibition leads to parkinsonian symptoms.
As a consequence of the lack of dopamine input to the basal ganglia, the output nucleus globus pallidus is excessively active (Lozano et al., 1998) and exerts overinhibition on pallidal-recipient thalamic nuclei (VLa, VA) via the pallido–thalamic tract (Magnin et al., 2000; Anderson et al., 2003). This overinhibition results in thalamic cell membrane hyperpolarization.
In the hyperpolarized state, deinactivation of calcium T-channels causes thalamic neurons to fire low-threshold calcium spike (LTS) bursts (Llinas and Jahnsen, 1982; Jeanmonod et al., 1996; Llinas and Steriade, 2006). In awake experimental animals free of TCD, some authors report very few spontaneous LTS (Woody et al., 2003; Ruiz et al., 2006), whereas others have found sizeable numbers in the higher-order thalamic nuclei (Ramcharan et al., 2005). Still, compared with this latter study, LTS bursts occur with more than twice higher prevalence in the central lateral and VLa/VA thalamic nuclei of PD patients (Jeanmonod et al., 1996; Magnin et al., 2000). The rhythmic LTS bursting was found with an interburst frequency of ∼4 Hz. As an example, Figure 6 shows a LTS burst recorded in VA.
Bursting thalamic relay neurons exert a rhythmic influence on thalamocortical modules in the theta frequency band (Hughes et al., 2004). The tight anatomical (Van Horn et al., 2000) and functional coupling between the thalamus and cortex is confirmed by the high theta coherence between the two (Fig. 1C). This coupling is sustained by thalamocorticothalamic and also by thalamoreticulothalamic and corticoreticulothalamic recurrent projections. The tendency of the thalamocortical network to maintain a given functional modality reinforces the hyperpolarized state over time (Pedroarena and Llinas, 1997). Thus, in thalamocortical modules, the presence of LTS bursts results in overproduction of theta rhythmic activity (Fig. 5A).
-
Divergent thalamocortical, corticothalamic, and reticulothalamic projections provide the anatomical substrate for diffusion of the theta overproduction to an increasing number of neighboring thalamocortical modules (Fig. 5B, theta cross-modular spread). After a sufficiently large number of thalamocortical modules have been recruited to the theta mode, this state of reduced activity may lead to negative clinical symptoms (e.g., akinesia). A theta or δ power increase may also become measurable in EEG (Fig. 1 A, Table 1) (Soikkeli et al., 1991; Stanzione et al., 1996; Tanaka et al., 2000) and MEG (Llinas et al., 1999; Salenius et al., 2002) and thalamic LFP (Fig. 1 B).
Why does the dominant EEG peak appear in the theta range? The similarity of peak frequencies in EEG and LFP and the high thalamocortical coherence (Table 1) suggest that thalamocortical interaction has a major influence on EEG rhythmicity. LTS exert influence on the thalamocortical system, but also cortical determinants affect the EEG, for example refractory periods, axonal transmission latencies, or cortical columnar organization (Nunez et al., 2001). This could explain why the presence of LTS in patients does not result in a sharp 4 Hz spectral peak but in excess EEG oscillations spread over the entire theta band.
Enhanced low-frequency oscillations also occur during sleep and cognitive tasks (Kahana et al., 2001), where they are considered normal. It is the long-lasting and widespread overproduction of slow rhythms in the waking brain that characterizes the pathophysiology.
In the final step, positive symptoms are produced (e.g., tremor) (Volkmann et al., 1992, 1996). This step is thought to be related to the reciprocal corticocortical inhibition mediated by GABAergic interneurons, which is a general feature of cortical organization (Fig. 5C). Thalamocortical modules in theta mode are in a state of reduced activity and therefore exert less collateral inhibition on other cortical modules. These modules are thereby overactivated in high (β/γ) frequencies. The importance of β/γ activity in human EEG is well documented (Neuper and Pfurtscheller, 2001; Schoffelen et al., 2005). We also find predominant thalamocortical β coherence between the thalamic site and EEG electrodes over the ipsilateral motor cortex (Fig. 4, Table 1). The interaction between modules in theta mode and modules in β/γ mode has been termed “edge effect” (Llinas et al., 1999, 2005). The mechanism has been inspired by the effect of lateral inhibition in the retina. Support for such an effect was first provided by the increased interfrequency covariation between theta and β ranges in MEG (Llinas et al., 1999). Recently, a spatiotemporal increase of β/γ activation caused by the presence of a conjoined low-frequency activation could be demonstrated in a slice preparation (Llinas et al., 2005). In this way, the negative and positive neurological symptoms are intricately related.
Figure 5.

Schema of thalamocortical circuits. We consider the three thalamocortical modules (A–C) to be identical. Module A is depicted in more detail (Jones, 2001). One module includes the following: (1) cortical layers (I, IV, V, and VI) with pyramidal cells and one gray GABAergic inhibitory cell; (2) nucleus reticularis (RT; gray GABAergic inhibitory cells); and (3) thalamus (TH), represented by one specific cell (e.g., in VA, VL) and one non-specific cell (e.g., in CL). The specific thalamic cell projects to the apical dendrites of both layer V and VI pyramidal cells, and collaterals sustain reticular feedback and cortical feedforward inhibitions. The nonspecific thalamic cell projects to the RT and to the layer V pyramidal neuron and has a divergent connection onto the neighboring module. The corticothalamic feedback connection is depicted as intramodular onto the RT and its thalamic relay cell and divergent intra- and cross-modular onto three thalamic relay cells. There are also divergent cross-modular reticulothalamic projections. The open arrows underline the cross-modular passages through thalamocortical, corticothalamic, reticulothalamic, and corticocortical pathways.
Figure 6.

LTS burst in thalamic nucleus VA. A, LTS bursting cell recorded in thalamic nucleus VA. Within the burst, the duration of each successive interspike interval increases progressively. The amplitude of the second spike was diminished with respect to the first in 80% of bursts (for discussion, see Llinas and Steriade, 2006). B, Two-dimensional interspike interval plot, for which the abscissa indicates the interspike interval to the previous spike and the ordinate indicates the interspike interval to the subsequent spike. The points at the bottom right represent the first spikes of bursts. C, The interspike interval histogram shows a bimodal distribution of a short intraburst interspike interval and a long interburst interspike interval of ∼225 ms. D, Mean and average of all interspike intervals grouped with respect to burst length show the progressive lengthening of the interspike interval and its small variation over all bursts. The number of bursts in each category is noted below the respective curve. E, The length of the first interspike interval decreases logarithmically (r2 = 0.99) as a function of the number of spikes in the burst. F, The rhythmicity of the LTS burst activity, with a lag of ∼225 ms, is confirmed by the autocorrelation histogram. ISI, Interspike interval.
Conclusions
Making use of the opportunity to record LFP from the human pallidal-recipient thalamus during therapeutic intervention, our findings add to the long-standing debate on the respective contributions of the thalamus and cortex to the rhythmicity recorded in scalp EEG (Nunez et al., 2001; Schreckenberger et al., 2004). Because the recordings stem from patients with PD, these results add to the physiological basis of our understanding of parkinsonian pathophysiology (Llinas, 1984; Llinas and Pare, 1994; Jeanmonod et al., 1996; Llinas et al., 1999), which has important consequences for therapy. Selective stereotactic ablation of the pallido-thalamic tract is thought to reduce overinhibition in the thalamus and thereby abolish excessive LTS and EEG theta power during waking, both central elements of TCD. In patients with severe forms of PD resistant to drug treatment, this therapeutic lesion results in ∼60% improvement of clinical symptoms over the medicated state (Magnin et al., 2001).
Footnotes
This work was supported by Swiss National Science Foundation Grant 3200B0-11028. We thank A. Morel for help on anatomy, R. Llinás for suggestions on the recording setup, P. Fries for discussions on multitaper analysis, and M. W. Jones for comments on a previous version of this manuscript.
References
- Anderson ME, Postupna N, Ruffo M. Effects of high-frequency stimulation in the internal globus pallidus on the activity of thalamic neurons in the awake monkey. J Neurophysiol. 2003;89:1150–1160. doi: 10.1152/jn.00475.2002. [DOI] [PubMed] [Google Scholar]
- Bullock TH, McClune MC, Achimowicz JZ, Iragui-Madoz VJ, Duckrow RB, Spencer SS. EEG coherence has structure in the millimeter domain: subdural and hippocampal recordings from epileptic patients. Electroencephalogr Clin Neurophysiol. 1995;95:161–177. doi: 10.1016/0013-4694(95)93347-a. [DOI] [PubMed] [Google Scholar]
- Contreras D, Destexhe A, Sejnowski TJ, Steriade M. Control of spatiotemporal coherence of a thalamic oscillation by corticothalamic feedback. Science. 1996;274:771–774. doi: 10.1126/science.274.5288.771. [DOI] [PubMed] [Google Scholar]
- Delorme A, Makeig S. EEGLAB: an open source toolbox for analysis of single-trial EEG dynamics including independent component analysis. J Neurosci Methods. 2004;134:9–21. doi: 10.1016/j.jneumeth.2003.10.009. [DOI] [PubMed] [Google Scholar]
- Destexhe A. Modelling corticothalamic feedback and the gating of the thalamus by the cerebral cortex. J Physiol (Paris) 2000;94:391–410. doi: 10.1016/s0928-4257(00)01093-7. [DOI] [PubMed] [Google Scholar]
- Engel AK, Konig P, Gray CM, Singer W. Stimulus-dependent neuronal oscillations in cat visual cortex: inter-columnar interaction as determined by cross-correlation analysis. Eur J Neurosci. 1990;2:588–606. doi: 10.1111/j.1460-9568.1990.tb00449.x. [DOI] [PubMed] [Google Scholar]
- Fogelson N, Williams D, Tijssen M, van Bruggen G, Speelman H, Brown P. Different functional loops between cerebral cortex and the subthalmic area in Parkinson's disease. Cereb Cortex. 2006;16:64–75. doi: 10.1093/cercor/bhi084. [DOI] [PubMed] [Google Scholar]
- Gotman J. Measurement of small time differences between EEG channels: method and application to epileptic seizure propagation. Electroencephalogr Clin Neurophysiol. 1983;56:501–514. doi: 10.1016/0013-4694(83)90235-3. [DOI] [PubMed] [Google Scholar]
- Hughes SW, Lorincz M, Cope DW, Blethyn KL, Kekesi KA, Parri HR, Juhasz G, Crunelli V. Synchronized oscillations at alpha and theta frequencies in the lateral geniculate nucleus. Neuron. 2004;42:253–268. doi: 10.1016/s0896-6273(04)00191-6. [DOI] [PubMed] [Google Scholar]
- Jeanmonod D, Magnin M, Morel A. Low-threshold calcium spike bursts in the human thalamus. Common physiopathology for sensory, motor and limbic positive symptoms. Brain. 1996;119:363–375. doi: 10.1093/brain/119.2.363. [DOI] [PubMed] [Google Scholar]
- Jones EG. The thalamic matrix and thalamocortical synchrony. Trends Neurosci. 2001;24:595–601. doi: 10.1016/s0166-2236(00)01922-6. [DOI] [PubMed] [Google Scholar]
- Kahana MJ, Seelig D, Madsen JR. Theta returns. Curr Opin Neurobiol. 2001;11:739–744. doi: 10.1016/s0959-4388(01)00278-1. [DOI] [PubMed] [Google Scholar]
- Llinas R. Rebound excitation as the physiological basis for tremor: a biophysical study of the oscillatory properties of mammalian central neurons in vitro. In: Findley LJ, Capildeo R, editors. Movement disorders: tremor. London: MacMillan; 1984. pp. 165–182. [Google Scholar]
- Llinas R, Jahnsen H. Electrophysiology of mammalian thalamic neurones in vitro. Nature. 1982;297:406–408. doi: 10.1038/297406a0. [DOI] [PubMed] [Google Scholar]
- Llinas R, Pare D. The role of intrinsic neuronal oscillations and network ensembles in the genesis of normal and pathological tremors. In: Findley LJ, Koller W, editors. Handbook of tremor disorders. New York: Marcel Dekker; 1994. pp. 7–36. [Google Scholar]
- Llinas R, Ribary U, Contreras D, Pedroarena C. The neuronal basis for consciousness. Philos Trans R Soc Lond B Biol Sci. 1998;353:1841–1849. doi: 10.1098/rstb.1998.0336. [DOI] [PMC free article] [PubMed] [Google Scholar]
- Llinas R, Ribary U, Jeanmonod D, Kronberg E, Mitra PP. Thalamocortical dysrhythmia: a neurological and neuropsychiatric syndrome characterized by magnetoencephalography. Proc Natl Acad Sci USA. 1999;96:15222–15227. doi: 10.1073/pnas.96.26.15222. [DOI] [PMC free article] [PubMed] [Google Scholar]
- Llinas R, Urbano FJ, Leznik E, Ramirez RR, van Marle HJ. Rhythmic and dysrhythmic thalamocortical dynamics: GABA systems and the edge effect. Trends Neurosci. 2005;28:325–333. doi: 10.1016/j.tins.2005.04.006. [DOI] [PubMed] [Google Scholar]
- Llinas RR, Steriade M. Bursting of thalamic neurons and states of vigilance. J Neurophysiol. 2006;95:3297–3308. doi: 10.1152/jn.00166.2006. [DOI] [PubMed] [Google Scholar]
- Lopes da Silva FH, von Lierop THMT, Schrijer CF, Storm van Leeuwen W. Organization of thalamic and cortical alpha rhythms: spectra and coherences. Electroencephalogr Clin Neurophysiol. 1973;35:627–639. doi: 10.1016/0013-4694(73)90216-2. [DOI] [PubMed] [Google Scholar]
- Lozano AM, Lang AE, Hutchison WD, Dostrovsky JO. New developments in understanding the etiology of Parkinson's disease and in its treatment. Curr Opin Neurobiol. 1998;8:783–790. doi: 10.1016/s0959-4388(98)80122-0. [DOI] [PubMed] [Google Scholar]
- Magnin M, Morel A, Jeanmonod D. Single-unit analysis of the pallidum, thalamus and subthalamic nucleus in parkinsonian patients. Neuroscience. 2000;96:549–564. doi: 10.1016/s0306-4522(99)00583-7. [DOI] [PubMed] [Google Scholar]
- Magnin M, Jeanmonod D, Morel A, Siegemund M. Surgical control of the human thalamocortical dysrhythmia: II. Pallidothalamic tractotomy in Parkinson's disease. Thalamus Related Syst. 2001;1:81–89. [Google Scholar]
- Mai JK, Assheuer J, Paxinos G. San Diego: Academic; 1997. Atlas of the human brain. [Google Scholar]
- Marsden JF, Ashby P, Limousin-Dowsey P, Rothwell JC, Brown P. Coherence between cerebellar thalamus, cortex and muscle in man: cerebellar thalamus interactions. Brain. 2000;123:1459–1470. doi: 10.1093/brain/123.7.1459. [DOI] [PubMed] [Google Scholar]
- Marsden JF, Limousin-Dowsey P, Ashby P, Pollak P, Brown P. Subthalamic nucleus, sensorimotor cortex and muscle interrelationships in Parkinson's disease. Brain. 2001;124:378–388. doi: 10.1093/brain/124.2.378. [DOI] [PubMed] [Google Scholar]
- Mitra PP, Pesaran B. Analysis of dynamic brain imaging data. Biophys J. 1999;76:691–708. doi: 10.1016/S0006-3495(99)77236-X. [DOI] [PMC free article] [PubMed] [Google Scholar]
- Morel A, Magnin M, Jeanmonod D. Multiarchitectonic and stereotactic atlas of the human thalamus. J Comp Neurol. 1997;387:588–630. doi: 10.1002/(sici)1096-9861(19971103)387:4<588::aid-cne8>3.0.co;2-z. [DOI] [PubMed] [Google Scholar]
- Morel A, Liu J, Wannier T, Jeanmonod D, Rouiller EM. Divergence and convergence of thalamocortical projections to premotor and supplementary motor cortex: a multiple tracing study in the macaque monkey. Eur J Neurosci. 2005;21:1007–1029. doi: 10.1111/j.1460-9568.2005.03921.x. [DOI] [PubMed] [Google Scholar]
- Neuper C, Pfurtscheller G. Event-related dynamics of cortical rhythms: frequency-specific features and functional correlates. Int J Psychophysiol. 2001;43:41–58. doi: 10.1016/s0167-8760(01)00178-7. [DOI] [PubMed] [Google Scholar]
- Nunez PL, Wingeier BM, Silberstein RB. Spatial-temporal structures of human alpha rhythms: theory, microcurrent sources, multiscale measurements, and global binding of local networks. Hum Brain Mapp. 2001;13:125–164. doi: 10.1002/hbm.1030. [DOI] [PMC free article] [PubMed] [Google Scholar]
- Paradiso G, Cunic D, Saint-Cyr JA, Hoque T, Lozano AM, Lang AE, Chen R. Involvement of human thalamus in the preparation of self-paced movement. Brain. 2004;127:2717–2731. doi: 10.1093/brain/awh288. [DOI] [PubMed] [Google Scholar]
- Pedroarena C, Llinas R. Dendritic calcium conductances generate high-frequency oscillation in thalamocortical neurons. Proc Natl Acad Sci USA. 1997;94:724–728. doi: 10.1073/pnas.94.2.724. [DOI] [PMC free article] [PubMed] [Google Scholar]
- Ramcharan EJ, Gnadt JW, Sherman SM. Higher-order thalamic relays burst more than first-order relays. Proc Natl Acad Sci USA. 2005;102:12236–12241. doi: 10.1073/pnas.0502843102. [DOI] [PMC free article] [PubMed] [Google Scholar]
- Rouiller EM, Tanne J, Moret V, Boussaoud D. Origin of thalamic inputs to the primary, premotor, and supplementary motor cortical areas and to area 46 in macaque monkeys: a multiple retrograde tracing study. J Comp Neurol. 1999;409:131–152. doi: 10.1002/(sici)1096-9861(19990621)409:1<131::aid-cne10>3.0.co;2-a. [DOI] [PubMed] [Google Scholar]
- Ruiz O, Royal D, Sary G, Chen X, Schall JD, Casagrande VA. Low-threshold Ca2+ -associated bursts are rare events in the LGN of the awake behaving monkey. J Neurophysiol. 2006;95:3401–3413. doi: 10.1152/jn.00008.2006. [DOI] [PubMed] [Google Scholar]
- Salenius S, Avikainen S, Kaakkola S, Hari R, Brown P. Defective cortical drive to muscle in Parkinson's disease and its improvement with levodopa. Brain. 2002;125:491–500. doi: 10.1093/brain/awf042. [DOI] [PubMed] [Google Scholar]
- Sarnthein J, Morel A, von Stein A, Jeanmonod D. Thalamic theta field potentials and EEG: high thalamocortical coherence in patients with neurogenic pain, epilepsy and movement disorders. Thalamus Related Syst. 2003;2:231–238. [Google Scholar]
- Schoffelen JM, Oostenveld R, Fries P. Neuronal coherence as a mechanism of effective corticospinal interaction. Science. 2005;308:111–113. doi: 10.1126/science.1107027. [DOI] [PubMed] [Google Scholar]
- Schreckenberger M, Lange-Asschenfeld C, Lochmann M, Mann K, Siessmeier T, Buchholz HG, Bartenstein P, Grunder G. The thalamus as the generator and modulator of EEG alpha rhythm: a combined PET/EEG study with lorazepam challenge in humans. NeuroImage. 2004;22:637–644. doi: 10.1016/j.neuroimage.2004.01.047. [DOI] [PubMed] [Google Scholar]
- Schürmann M, Demiralp T, Basar E, Basar-Eroglu C. Electroencephalogram alpha (8–15 Hz) responses to visual stimuli in cat cortex, thalamus, and hippocampus: a distributed alpha network? Neurosci Lett. 2000;292:175–178. doi: 10.1016/s0304-3940(00)01456-7. [DOI] [PubMed] [Google Scholar]
- Soikkeli R, Partanen J, Soininen H, Paakkonen A, Riekkinen P., Sr Slowing of EEG in Parkinson's disease. Electroencephalogr Clin Neurophysiol. 1991;79:159–165. doi: 10.1016/0013-4694(91)90134-p. [DOI] [PubMed] [Google Scholar]
- Stanzione P, Marciani MG, Maschio M, Bassetti MA, Spanedda F, Pierantozzi M, Semprini R, Bernardi G. Quantitative EEG changes in non-demented Parkinson's disease patients before and during L-dopa therapy. Eur J Neurol. 1996;3:354–362. [Google Scholar]
- Tanaka H, Koenig T, Pascual-Marqui RD, Hirata K, Kochi K, Lehmann D. Event-related potential and EEG measures in Parkinson's disease without and with dementia. Dement Geriatr Cogn Disord. 2000;11:39–45. doi: 10.1159/000017212. [DOI] [PubMed] [Google Scholar]
- Van Horn SC, Erisir A, Sherman SM. Relative distribution of synapses in the A-laminae of the lateral geniculate nucleus of the cat. J Comp Neurol. 2000;416:509–520. [PubMed] [Google Scholar]
- Volkmann J, Lado F, Ioannides AA, Mogilner A, Joliot M, Ribary U, Fazzini E, Llinas R. Magnetic recording of resting tremor related brain activity in Parkinson's disease. Soc Neurosci Abstr. 1992;22:936. [Google Scholar]
- Volkmann J, Joliot M, Mogilner A, Ioannides AA, Lado F, Fazzini E, Ribary U, Llinas R. Central motor loop oscillations in parkinsonian resting tremor revealed by magnetoencephalography. Neurology. 1996;46:1359–1370. doi: 10.1212/wnl.46.5.1359. [DOI] [PubMed] [Google Scholar]
- Wennberg RA, Lozano AM. Intracranial volume conduction of cortical spikes and sleep potentials recorded with deep brain stimulating electrodes. Clin Neurophysiol. 2003;114:1403–1418. doi: 10.1016/s1388-2457(03)00152-4. [DOI] [PubMed] [Google Scholar]
- Williams D, Tijssen M, Van Bruggen G, Bosch A, Insola A, Di Lazzaro V, Mazzone P, Oliviero A, Quartarone A, Speelman H, Brown P. Dopamine-dependent changes in the functional connectivity between basal ganglia and cerebral cortex in humans. Brain. 2002;125:1558–1569. doi: 10.1093/brain/awf156. [DOI] [PubMed] [Google Scholar]
- Woody CD, Gruen E, Wang XF. Electrical properties affecting discharge of units of the mid and posterolateral thalamus of conscious cats. Neuroscience. 2003;122:531–539. doi: 10.1016/j.neuroscience.2003.08.011. [DOI] [PubMed] [Google Scholar]