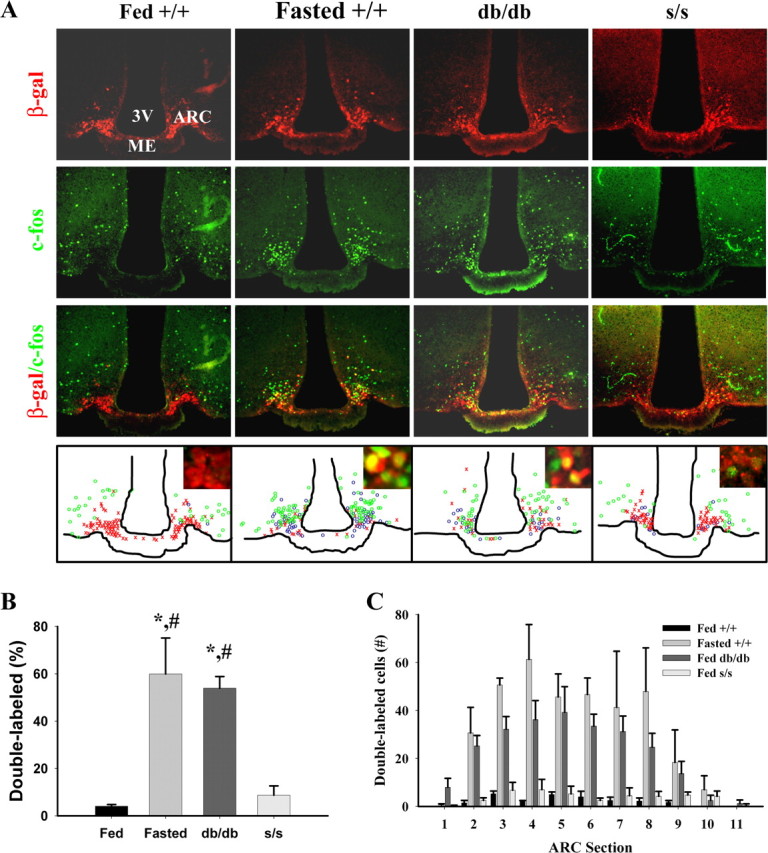
Figure 2.

CFLIR in AgRP neurons of fasted +/+ and ad libitum-fed +/+, db/db, and s/s animals. All mouse groups were bred onto a background expressing LacZ under the AgRP promoter, enabling the identification of AgRP neurons by staining for β-Gal; ad libitum-fed +/+, db/db, and s/s mice and fasted +/+ animals on this background were subjected to IHC analysis. A, Representative images showing immunofluorescent detection of c-Fos (green, top), β-Gal (red, top middle), and merged c-Fos/β-Gal (bottom middle). Bottom, Schematic drawings of AgRP (β-Gal, red × symbols), c-Fos (green circles), and double (AgRP/c-Fos, blue circles) labeled neurons in representative sections (approximately bregma −1.9 mm). Insets show high magnifications of AgRP neurons within the ARC. B, Quantification of double-labeled c-Fos/AgRP neurons from animals treated as in A. Total AgRP neurons were normalized to 100% for the different mouse groups, and double-labeled AgRP neurons are plotted as percentage ± SEM of total AgRP neurons. C, Distribution of double-labeled neurons throughout the ARC. Total c-Fos/AgRP double-labeled neurons per sections are plotted for each genotype/treatment group. Statistical differences between groups were tested by two-way ANOVA (p < 0.0001), and Fisher's PLSD was performed for post hoc analysis (*p < 0.0001 vs fed +/+; #p < 0.001 vs fed s/s). Differences in total numbers of AgRP neurons within the groups were tested using ANOVA analysis (p = 0.21) and Fisher's PLSD and showed no significant differences among the groups, although the number of AgRP-positive neurons trended down in db/db mice compared with other groups (p = 0.12 vs +/+). Group sizes were n = 4 (fed +/+, fed db/db, and fed s/s) or n = 3 (fasted +/+). 3V, Third ventricle; ME, median eminence.
