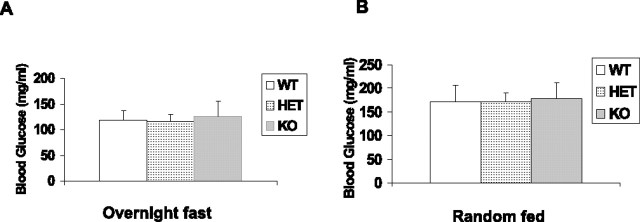
Figure 3.
Blood glucose levels of fasting and random-fed mice. A, Blood glucose concentrations from overnight fasted mice. Values are the mean ± SEM for WT (n = 4 males and 4 females), HET (n = 5 males and 5 females), and KO mice (n = 5 males and 6 females). B, Blood glucose concentrations from random-fed mice. Values are the mean ± SEM for WT, HET, and KO mice. Same number of animals were used as in the overnight fasting group. The statistical analysis used for this experiment is one-way ANOVA and unpaired t test.

