
Figure 7.
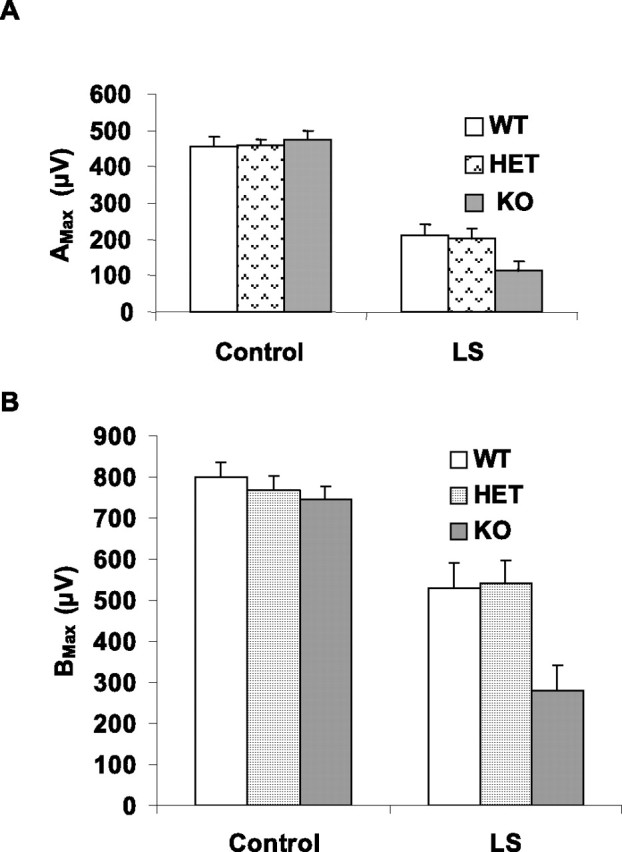
ERG sensitivity of WT, HET, and KO mouse retina before and after light stress. A, Amax of WT, HET, and KO groups before and after light stress (LS). B, Bmax of WT, HET, and KO before and after light stress. After light stress, there was a reduction in both a- and b-wave responses in all three groups. The KO response was significantly lower than that of the WT and HET retinas (p < 0.05). The statistical analysis used for this experiment is one-way ANOVA and unpaired t test.