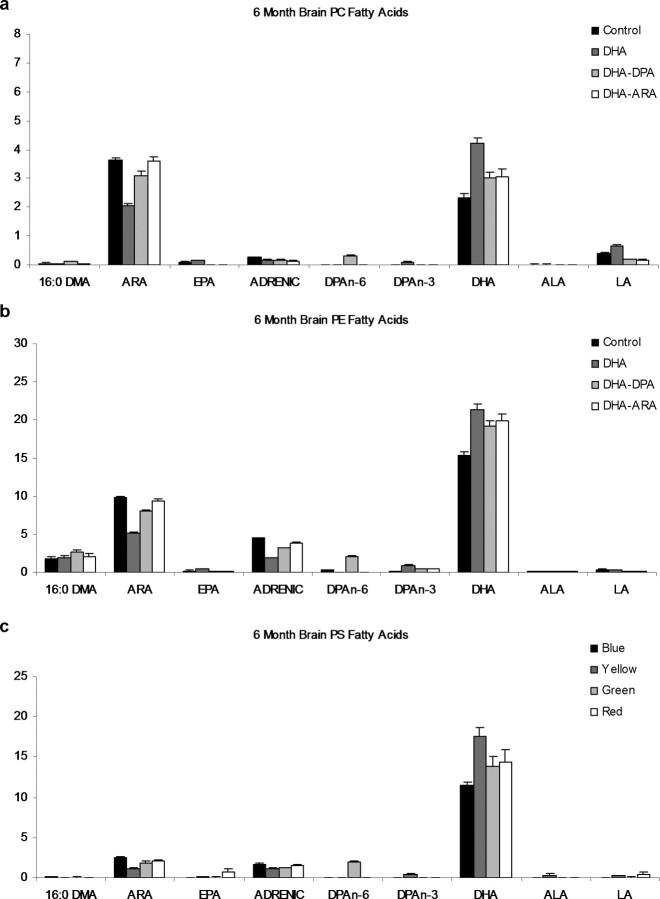
Figure 2.
Whole-brain phospholipid fatty acid profiles in 3xTg-AD mice after dietary supplementation. Whole-brain phospholipid fatty acid profiles of the four groups after 3 months of dietary supplementation (n = 6) are shown. Values are expressed as a weight percentage of total brain fatty acids. The four diets are shown as control, DHA, DHA–DPA, and DHA–ARA. Error bars indicate SEM. DMA, Dimethylacetals; LA, linoleic acid (n-6); ADRENIC, adrenic acid (n-6).

