Figure 5.
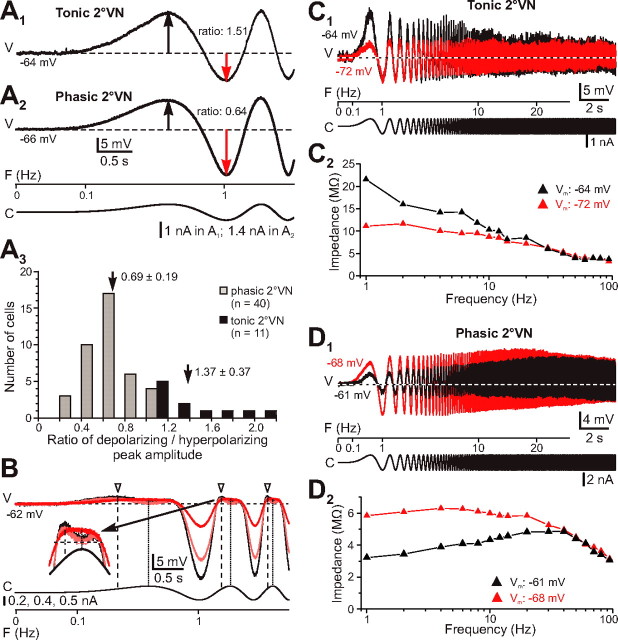
Response asymmetry in tonic and phasic 2°VNs. A, The ratio of the depolarizing (black arrows in A1, A2)/hyperpolarizing half wave (red arrow in A1, A2) of the responses evoked by sinusoidally modulated currents is >1 for tonic and <1 for phasic 2°VNs (A3). Horizontal dashed lines in A1 and A2 indicate resting membrane potential at −64 mV (A1) and −66 mV (A2); arrows and numbers in A3 indicate mean ± SD of the ratios for tonic and phasic 2°VNs. Calibration in A2 applies to A1. B, Response of a phasic 2°VN evoked by ZAP currents. The response shows a marked asymmetry and a particular distortion in the falling phase of the depolarizing half wave at higher stimulus intensities (pink and black traces; see inset for extended timescale); the response peak (white arrowhead and vertical dashed line) occurs before the maximal depolarizing current is reached (vertical dotted line), and the membrane potential starts to hyperpolarize. C, D, Overlay of responses evoked by injection of ZAP currents at resting membrane potential (red traces) and during constant depolarization (black traces) of a tonic (C) and a phasic 2°VN (D). The impedance during depolarization of the membrane potential (Vm) increases in tonic but decreases in phasic 2°VNs at low- and mid-range frequencies (black triangles in C2, D2). Dashed lines in C1 and D1 indicate membrane potential before the onset of the stimulus. V, Voltage; F, frequency; C, current.

