
Figure 7.
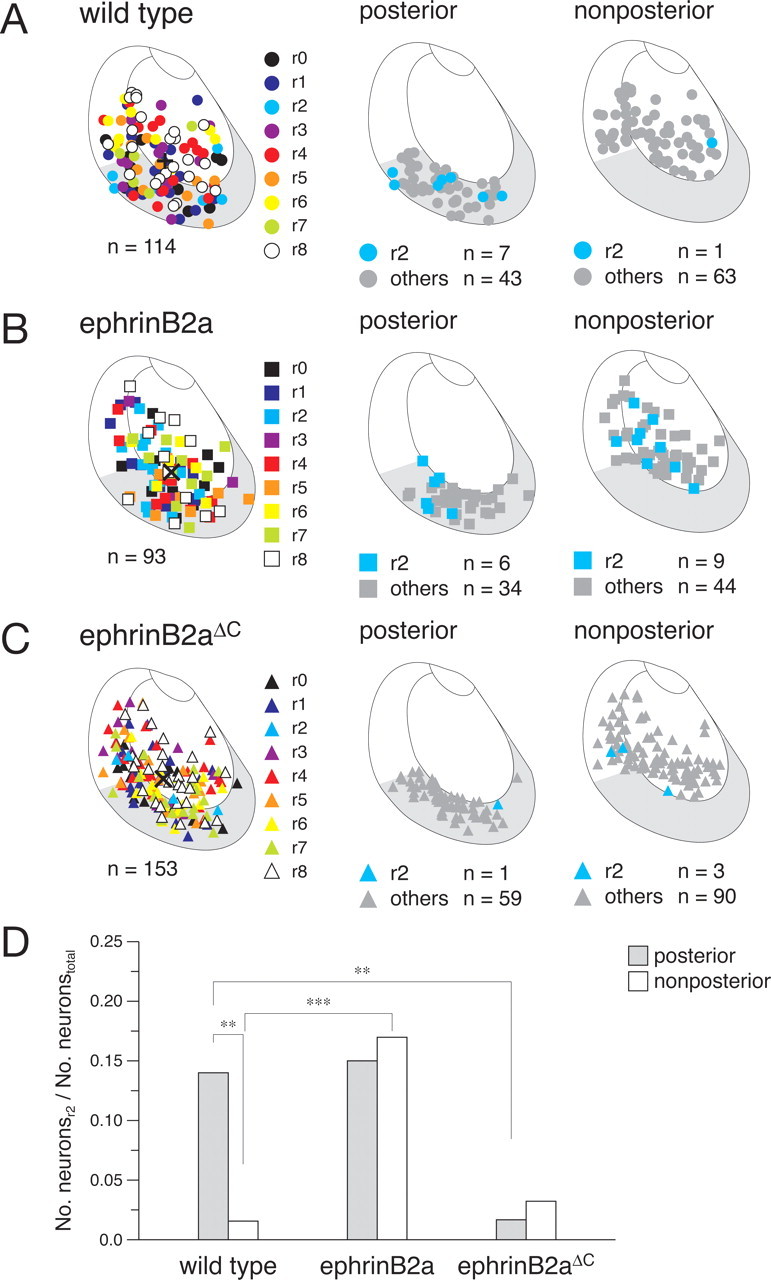
Effects of the ectopic expression of ephrinB2a and ephrinB2a ΔC on the probabilities of neurons projecting to r2. A, Locations of somata for 114 labeled neurons in wild-type embryos (colored circles, left). Wild-type neurons projecting to r2 (blue circles) and the other labeled neurons (gray circles) in the posterior tectum (middle) and the nonposterior tectum (right). B, Locations of somata for 93 labeled neurons expressing ephrinB2a (left, colored squares). ephrinB2a-expressing neurons projecting to r2 (blue squares) and the other labeled neurons (gray squares) in the posterior tectum (middle) and the nonposterior tectum (right). C, Locations of somata for 153 labeled neurons expressing ephrinB2a ΔC (left, colored triangles). ephrinB2a ΔC-expressing neurons projecting to r2 (blue triangles) and the other labeled neurons (gray triangles) in the posterior tectum (middle) and the nonposterior tectum (right). A–C, Crosses indicate the centers of gravity of the distributions of labeled neurons. D, Ratios of the number of neurons projecting to r2 to the total number of labeled neurons in the posterior tectum (shaded columns) and in the nonposterior tectum (open columns) for wild-type, ephrinB2a, and ephrinB2aΔC embryos. Pairwise comparisons of ratios with significant differences: **p < 0.01 and ***p < 0.001 (two-tailed binomial test).