
Figure 2.
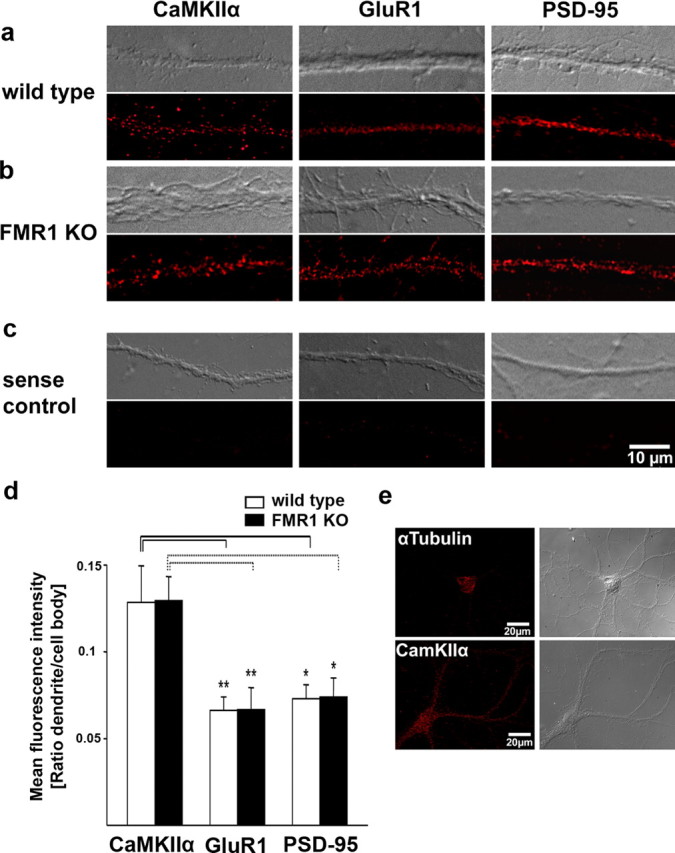
Quantitative analysis of FISH signals for CaMKIIα, GluR1, and PSD-95 mRNAs in cultured cortical neurons from wild-type and Fmr1 knock-out mice. a–c, e, Postnatal cortical neurons (14 d in vitro) from wild-type (a) and Fmr1 knock-out (b) neurons were hybridized with digoxigenin-labeled oligonucleotide probes to specific mRNAs (see Materials and Methods) and detected with Cy3-conjugated antidigoxigenin antibodies. CaMKIIα mRNAs were distributed throughout dendrites in the form of granules. A similar pattern was observed for GluR1 mRNA and PSD-95 mRNA. c, Low background staining was detected with sense probes. Exposure times and image processing were identical for each sample. Top, Corresponding differential interference contrast (DIC) image; bottom, FISH signals. d, Quantification of FISH signals in dendrites from wild-type and Fmr1 knock-out mice. Columns display mean fluorescent intensities in dendrites normalized to the signal intensity in cell bodies. Error bars represent SEM. No significant differences in normalized dendritic signal intensities between wild-type and Fmr1 knock-out neurons could be detected for CaMKIIα, GluR1, and PSD-95 mRNAs, as shown by two-tailed unpaired t tests (CaMKIIα, nwt = 18, nko = 15, p = 0.97; GluR1, nwt = 20, nko = 17, p = 0.98; PSD-95, nwt = 19, nko = 19, p = 0.94). Normalized dendritic intensities for CaMKIIα mRNAs are significantly higher than for GluR1 and PSD-95 mRNAs in both wild-type (black lines) and Fmr1 knock-out neurons (dashed lines) (*p < 0.05, **p < 0.01, one-way ANOVA and Games–Howell post hoc test). e, Control for the specificity of dendritic FISH signals. In situ hybridizations with probes for α-tubulin mRNA display a clear staining in the cell body, but only faint staining in proximal dendrites, whereas CaMKIIα specific FISH signals are strong in the cell body and throughout the entire dendrites. Left, FISH signals; right, corresponding DIC image.