Figure 1.
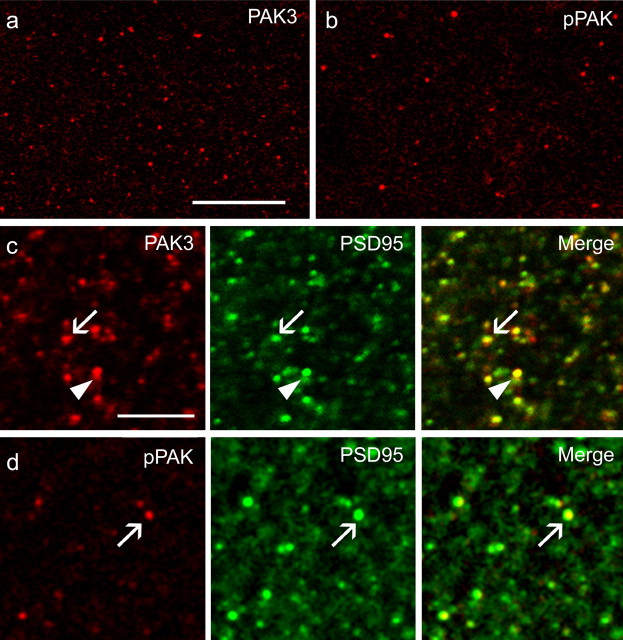
Immunostaining for total and pPAK proteins in stratum radiatum of hippocampal field CA1. a, b, Laser-scanning confocal micrographs show the distributions of immunolabeling for PAK3 (a) and pPAK (b). The CA1 cell body layer is to the right (data not shown) in each micrograph. Note that dense pPAK-IR puncta are much less numerous than the comparably sized structures labeled for total PAK3 immunoreactivity. Scale bar, 10 μm. c, Confocal micrographs illustrate the distributions of PAK3 (red), PSD95 (green), and overlapped immunolabeling (yellow in Merge). PAK3-IR puncta were typically associated with dense labeling for PSD95, with the latter either capping (arrow) or overlapping (arrowhead) the PAK3 immunoreactivity. Scale bar, 5 μm. d, Confocal micrographs show profiles labeled with anti-pPAK (red) and anti-PSD95 (green) and the overlap of the two (yellow in Merge). The majority of pPAK-IR profiles were associated with PSD95 immunoreactivity. Scale bar, 5 μm.

