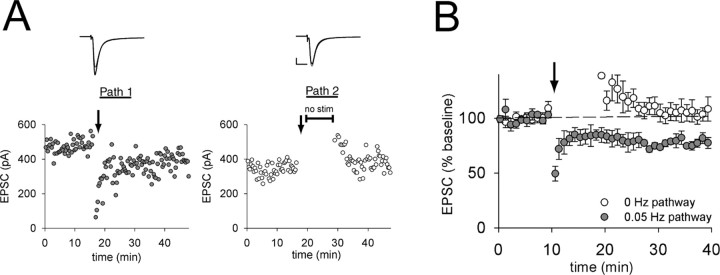
Figure 2.
Activity dependence of eCB-LTD. A, B, Example (A) and summary (B; n = 6) of experiments in which both pathways received tetanic stimulation (100 Hz/1 s given 4 times at arrows) to elicit eCB production and release. Baseline stimulation (0.05 Hz) was then stopped in one pathway for 10 min. Thick traces of sample EPSCs are averages taken during the 10 min baselines. Thin traces are averages taken at 40–45 min. Calibration: 10 ms, 100 pA.

