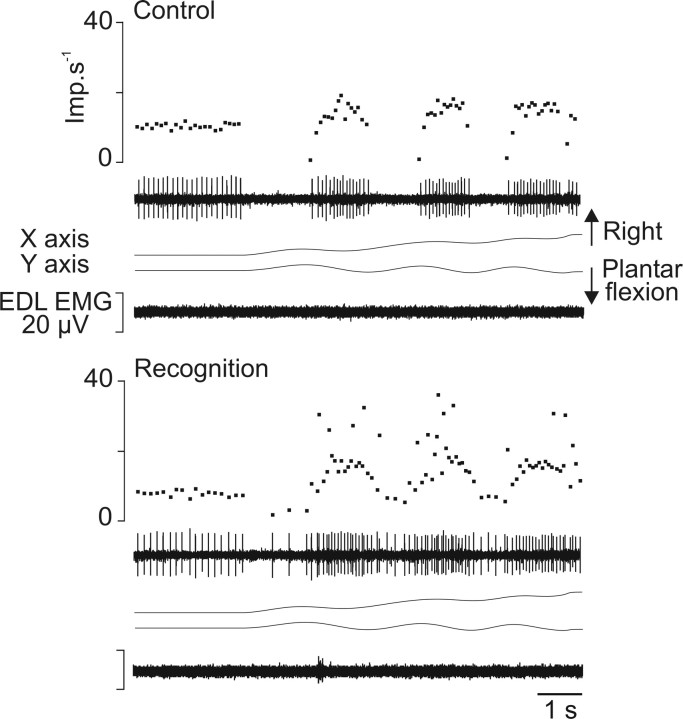
Figure 4.
Example of the increased variability of the instantaneous frequency of Ia afferents during recognition compared with control. During control and recognition sessions (top and bottom part, respectively), the responses of an Ia afferent from the EDL muscle (unit 5) (Table 1) to imposed movement forming the word “in” are illustrated. Each part of the figure, from top to bottom, illustrates the instantaneous frequency curve and spike train, the imposed movement represented by its x and y coordinates, and EMG activity of the receptor-bearing muscle. Imp, Impulse.

