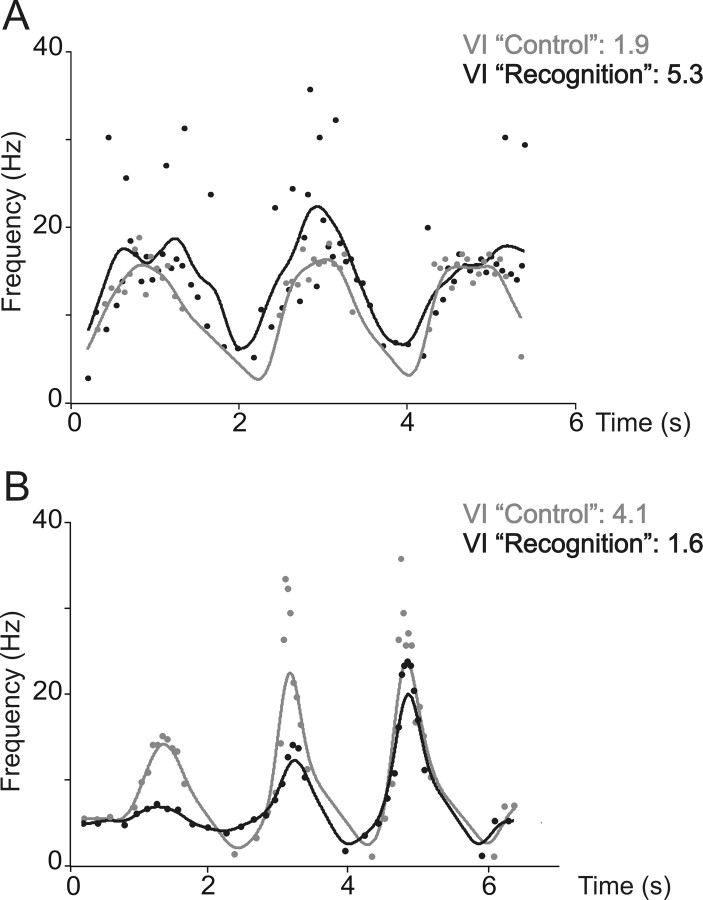
Figure 7.
Characterization of the Ia afferent responses by the VI. A, The responses of the Ia afferent, previously shown on Figure 4, were filtered using a Hanning window (see Materials and Methods) during control (gray symbols and curve) and recognition (black symbols and curve). The VIs are given on the upper right part. Note that the VI increases during recognition. B, Same as in A, with the responses of Ia afferent previously shown in Figure 5. Note that VI decreases during recognition.

