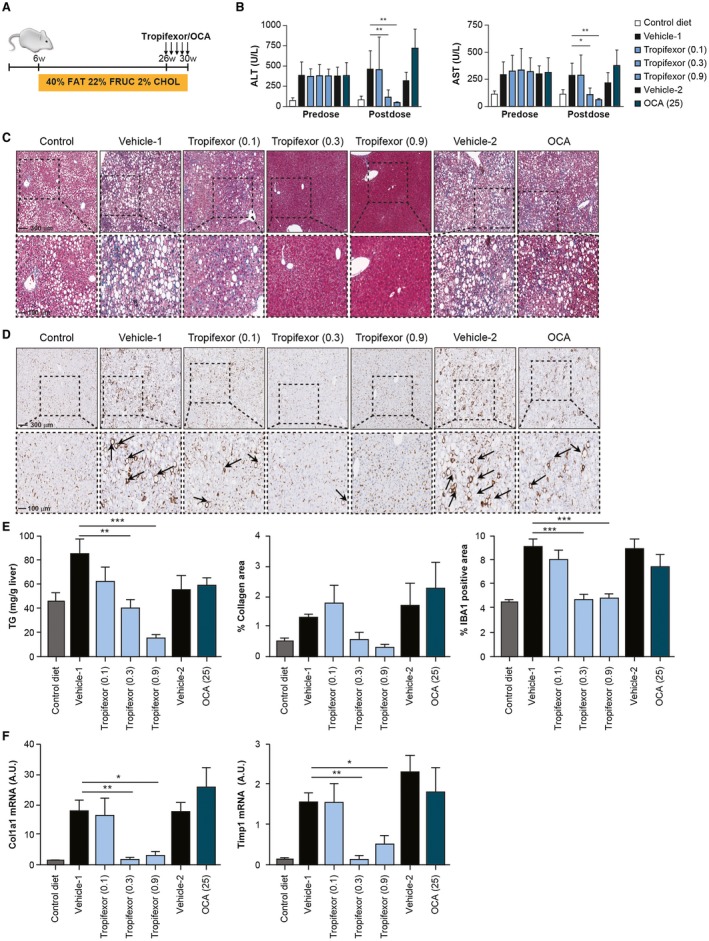
Figure 3.

Tropifexor reverses fibrosis in a diet‐driven insulin‐resistant model of NASH. (A) Schematic representation of the diet‐driven mouse model for induction of NASH. Control animals received standard chow (10% kcal from fat, with no fructose or cholesterol), and NASH animals received high fat (40% kcal), high fructose (20% by weight), and high cholesterol (2% by weight) from 6 to 26 weeks. NASH animals were subsequently treated for 4 weeks with tropifexor (0.1, 0.3, or 0.9 mg/kg), OCA (25 mg/kg), or respective vehicles. (B) Serum markers AST and ALT were markedly elevated in NASH animals before dosing and were reduced in a dose‐dependent manner following 4 weeks of dosing with tropifexor but not OCA. *P < 0.05, **P < 0.01 compared to vehicle control by two‐way ANOVA with Dunnett's test. (C) Trichrome‐stained liver sections show dose‐dependent improvement in liver damage, and (D) IBA1‐stained liver sections show dose‐dependent decrease in infiltration of crown‐like macrophages (arrowheads) following treatment with tropifexor. (E) Hepatic triglyceride levels, collagen ratio as determined by trichrome‐positive areas, and IBA1‐positive areas were significantly reduced with tropifexor. **P < 0.01, ***P < 0.001 compared to vehicle control by one‐way ANOVA with Dunnett's test. (F) Expression levels of profibrogenic markers Col1a1 and Timp1 were also reduced in livers of tropifexor‐treated animals in a dose‐dependent manner. *P < 0.05, **P < 0.01 compared to vehicle control by one‐way ANOVA with Dunnett's test. Abbreviations: CHOL, cholesterol; FRUC, fructose; TG, triglyceride; w, weeks.
