
Figure 2.
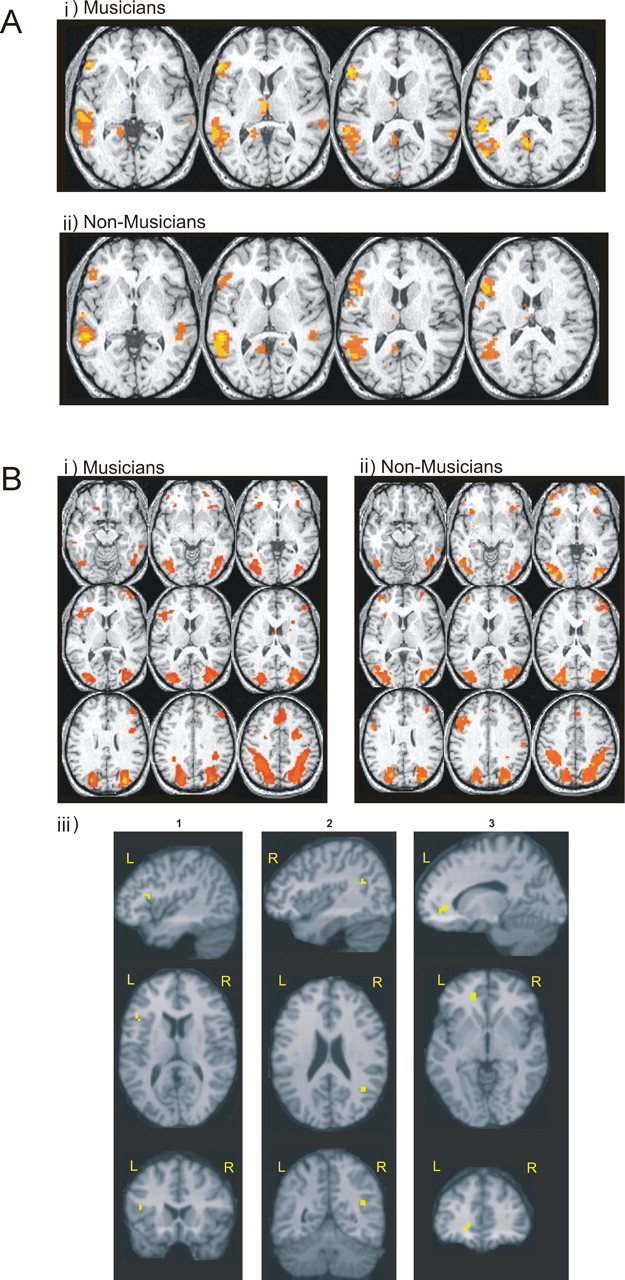
A, Brain activations in musicians and controls during the assessment of verbal intellectual ability. Bi, Bii, Activations resulting from within-group random-effects analyses for musicians (i) and nonmusicians (ii) at z-slice levels used by Sergent et al. (1992) to describe the sight-reading neural network. Top row, Broca's area in left hemisphere activated in musicians only; middle and bottom rows, premotor and parietal cortices activated in both groups. Biii, Results of the random-effects group differences analysis projected onto a structural MR scan of a subject selected at random from the volunteers, showing regions with significantly increased BOLD signal in musicians compared with nonmusicians during 3DMR task performance (column 1, left pars operculum, x = −45, y = 18, z = 14, t = 6.56, 6 voxels; column 2, right angular gyrus, x = 42, y = −54, z = 23, t = 4.11, 6 voxels; column 3, left anterior cingulate gyrus, x = −15, y = 38, z = 6, t = 5.82, 14 voxels).