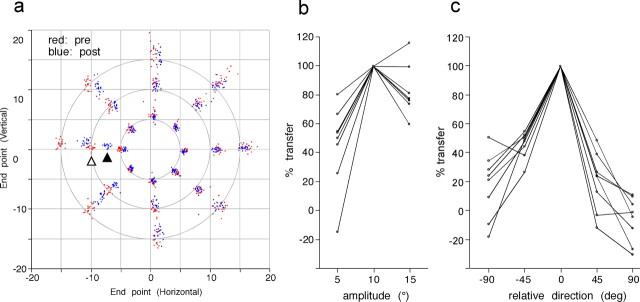
Figure 2.
Spatial characteristics of microstimulation-induced adaptive changes. a, Transfer of the induced change to saccades to target steps of various vectors. Data are from the same experiment shown in Figure 1, b and c. Saccade endpoints relative to initial target location before (red) and after (blue) stimulation session are shown in two dimensions. Open and filled triangles indicate clusters of endpoints in prestimulation and poststimulation session for saccades to 10° leftward target steps. b, Summary for eight experiments (monkey I). Relative amplitude of endpoint shift is shown for saccades to 5, 10, and 15° target movements in the adapted direction. c, Similar plot of relative shift amplitude for saccades to 10° target movements in five directions. Abscissa indicates directional difference from the adapted direction. Positive indicates clockwise deviation.

