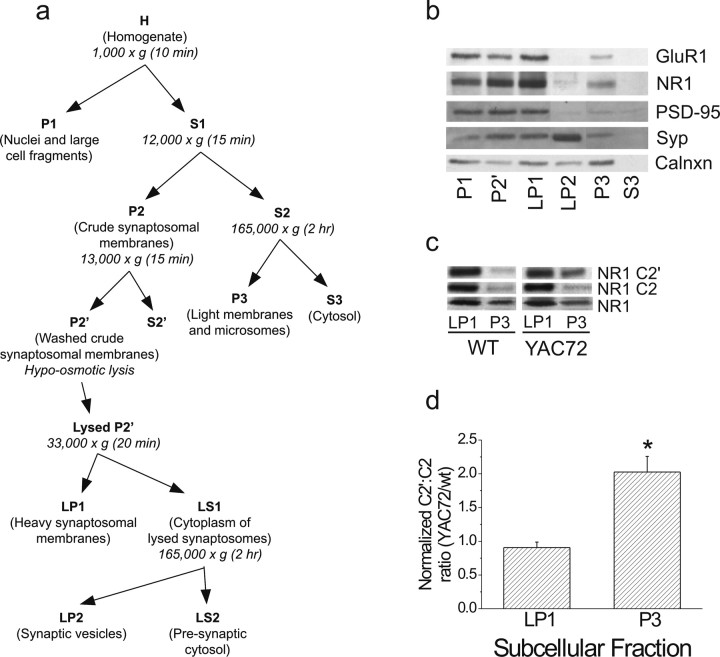
Figure 6.
NR1 C2′ isoform is present in the P3 fraction at higher levels in striatal tissue from YAC72 versus wt mice. Pooled tissue from 2-month-old mice was fractionated by centrifugation into different subcellular components and analyzed by immunoblotting. a, Schematic for biochemical fractionation; for details of the protocol as depicted in this schematic, see Materials and Methods. b, Characterization of fractionated subcellular compartments of striata from wt mice. Fractions were resolved by SDS-PAGE and immunoblotted with antibodies against GluR1 (topmost), NR1 (top middle), PSD-95 (middle), synaptophysin (bottom middle), and calnexin (bottommost). Synaptophysin (syp) is most highly expressed in LP2, calnexin (calnxn) is concentrated in P3, and PSD-95 is enriched in LP1, whereas NR1 and GluR1 are present in both LP1 and P3 fractions. c, Sample blot showing the relative distribution of each of NR1, NR1 C2, and NR1 C2′ in two fractions, LP1 and P3. Twenty micrograms of protein were loaded for each sample. Expression of the NR1 C2′ isoform, but not of NR1 C2 or the NR1 subunit in general, was enhanced in the P3 fraction of striatal tissue from YAC72 mice compared with wt. d, Quantitation of the C2′/C2 ratio in LP1 and P3 fractions of striatal tissue from 2-month-old YAC72 mice relative to wt. C2′/C2 ratios were calculated for each genotype, and ratios for YAC72 were then normalized to wt values in each of the paired experiments. Bars represent mean ± SEM from experiments using n = 3 independent fractionations each of striatal tissue pooled from 10 to 30 mice of each genotype. The C2′/C2 ratios for YAC72 normalized to those for wt tissue are significantly higher in the P3 fraction compared with LP1. Significantly different, *p < 0.05 by paired t test.

