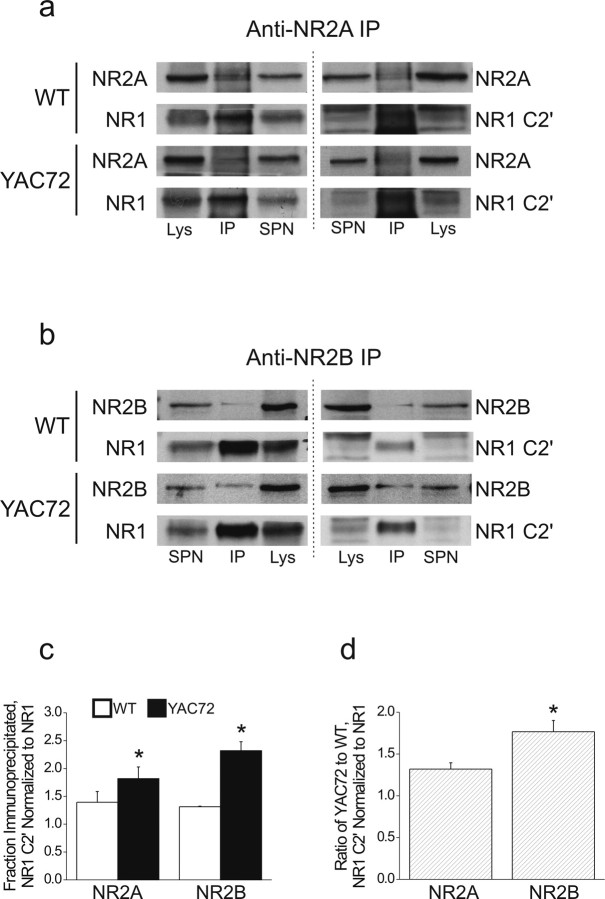
Figure 7.
Association of NR2 subunits with NR1 C2′ is increased in striatal tissue from YAC72 versus wt mice. a, Representative immunoblots from anti-NR2A immunoprecipitations. Interacting NR1 subunits in general (left) or NR1 C2′ isoforms (right) in particular are detected by immunoblotting. Lys, Lysate; IP, immunoprecipitate; SPN, supernatant. b, Representative immunoblots from anti-NR2B immunoprecipitations. c, Plot showing fraction of immunoprecipitated NR1 C2′ normalized to NR1. Fractions of total NR1 or C2′-containing NR1 that coprecipitated with NR2A or NR2B were individually calculated. Values for NR1 C2′ were then normalized to NR1 values. Bars represent mean ± SEM of the normalized immunoprecipitated NR1 C2′/NR1 ratio, from n = 3 independent experiments in which wt and YAC72 samples were processed and analyzed in parallel. Significantly different compared with wt, *p < 0.05 by paired t test. d, Plot showing fold change in YAC72 versus wt ratios of normalized immunoprecipitated NR1 C2′/NR1. Values shown are averaged from n = 3 experiments in which both wt and YAC72 samples were processed and analyzed in parallel. Significantly different compared with NR2A, *p < 0.05 by paired t test.

