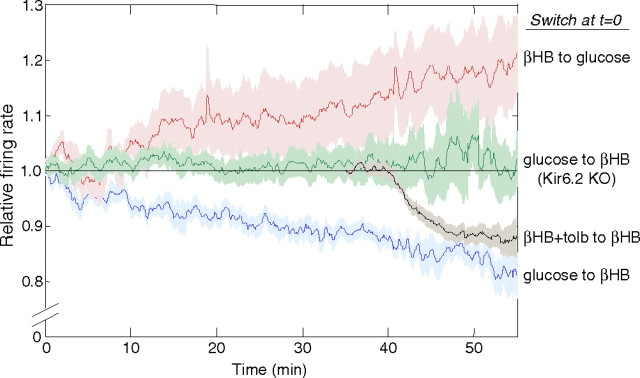
Figure 5.
Time course of firing rate changes with ketone body application and with tolbutamide (tolb) washout. A switch of metabolites (glucose to glucose plus βHB or the reverse switch for the red trace) occurred at time zero. The firing rate of individual cells, normalized to their control value (5 min average), was averaged to give the mean trace and SEM (shaded zone). Data are shown for the forward switch under control conditions (blue), for the reverse switch (red), and for the forward switch in slices from Kir6.2 (−/−) knock-out (KO) animals (green). The black trace is from slices placed in glucose (12 mm) and tolbutamide (200 μm) at −15 min, then switched to glucose (12 mm) plus βHB (2 mm) plus tolbutamide (200 μm) at time zero. Recordings began in glucose plus βHB plus tolbutamide at or before 30 min, and then a switch to glucose plus βHB occurred at 35 min. After a lag for the perfusion delay and tolbutamide washout, the firing rate quickly falls to approximately the rate seen for the ordinary forward switch. Numbers of experiments contributing to each trace (with smallest n at latest time points) are as follows: blue, n = 8–15; red, n = 7; green, n = 9–16; and black, n = 12–29.

