

Abstract
Cerebellar unipolar brush cells (UBCs) are glutamatergic interneurons that receive direct input from vestibular afferents in the form of a unique excitatory synapse on their dendritic brush. UBCs constitute independent relay lines for vestibular signals, and their inherent properties most likely determine how vestibular activity is encoded by the cerebellar cortex. We now demonstrate that UBCs are bimodal cells; they can either fire high-frequency bursts of action potentials when stimulated from hyperpolarized potentials or discharge tonically during sustained depolarizations. The two functional states can be triggered by physiological-like activity of the excitatory input and are encoded by distinct Ca2+-signaling systems. By combining complementary strategies, consisting of molecular and electrophysiological analysis and of ultrafast acousto-optical deflector-based two-photon imaging, we unraveled the identity and the subcellular localization of the Ca2+ conductances activating in each mode. Fast inactivating T-type Ca2+ channels produce low-threshold spikes, which trigger the high-frequency bursts and generate powerful Ca2+ transients in the brush and, to a much lesser extent, in the soma. The tonic firing mode is encoded by a signalization system principally composed of L-type channels. Ca2+ influx during tonic firing produces a linear representation of the spike rate of the cell in the form of a widespread and sustained Ca2+ concentration increase and regulates cellular excitability via BK potassium channels. The bimodal firing pattern of UBCs may underlie different coding strategies of the vestibular input by the cerebellum, thus likely increasing the computational power of this structure.
Keywords: unipolar brush cells, UBC, vestibulocerebellum, AOD-based two-photon imaging, T-type channels, L-type channels
Introduction
The most caudal, or flocculonodular, lobe of the cerebellum is generally known as vestibulocerebellum. As its name suggests, the vestibulocerebellum processes information mainly from the vestibular system, receiving both direct ipsilateral sensory afferences from primary nuclei and bilateral projections from brainstem secondary nuclei (Barmack, 2003). Integrating sensory and motor components, the vestibulocerebellum regulates ocular movements and controls head and trunk posture, thus contributing to the correct positioning of the body in space.
In this study, we examine a poorly characterized neuronal type displaying a central position in the granule cell layer of vestibulocerebellar lobules: the unipolar brush cell (UBC) (Altman and Bayer, 1977; Floris et al., 1994). UBCs form a class of glutamatergic interneurons (Nunzi et al., 2001) morphologically characterized by a single dendrite originating from the soma and terminating in a brush-like structure composed of several dendrioles. A key region for synaptic integration, the brush receives a single giant excitatory synapse, which is formed either by an extrinsic vestibular fiber or by the axon of another UBC (Jaarsma et al., 1995; Mugnaini et al., 1997; Nunzi et al., 2000, 2001). The presynaptic element of this synapse shows the typical ultrastructure of mossy fiber (mf) terminals but forms an exceptionally extended synaptic contact that can entrap glutamate for several hundred milliseconds, thus enabling unusually long excitatory responses (Rossi et al., 1995; Kinney et al., 1997). This unique input is tempered by the mixed GABAergic/glycinergic inhibition provided by Golgi cell terminals, impinging onto both the brush and the soma (Mugnaini et al., 1997; Dugué et al., 2005).
UBCs provide a strong feed-forward excitatory input onto other UBCs and granule cells (Nunzi et al., 2000, 2001) via axonal mf-like terminals and possibly onto granule cells via dendrodendritic synapses (Mugnaini et al., 1997). Several arguments suggest that UBCs are important elements in the vestibulocerebellar circuitry. First, ∼50% of the mf terminals arise from UBCs (Nunzi and Mugnaini, 2000). Second, their distribution spreads with evolution beyond the vestibulocerebellum. Indeed, in primates, UBCs are an integral part of the neuronal circuitry also in vermal lobules related to spinal functions (Vig et al., 2005).
UBCs participate to the elaboration of the complex response patterns encountered in the vestibulocerebellar cortex (Simpson et al., 2005). Nevertheless, little is known about their function. A modeling study suggests that the peculiar mf synapse input would code for a delayed representation of vestibular information (Roberts, 2004). Alternatively, UBCs may integrate and/or amplify acceleration- and position-related vestibular signals. In all cases, their intrinsic properties are most likely determinant factors for their computational properties. Here, we provide the first detailed account of the intrinsic excitability of UBCs and show that bursting and tonic firing define separate functional states (Llinas and Jahnsen, 1982). By combining electrophysiology, imaging, and molecular analysis, we examine the relationship between the activity displayed by UBCs and the underlying voltage-dependent Ca2+ conductances (VDCCs). In particular, we show that the brush expresses VDCCs at high density, which determine the integration and potentially the dynamic control of the sensory information transiting via UBCs.
Materials and Methods
Slice preparation.
Experiments were performed on slices from the cerebellum of 17- to 22-d-old Wistar rats. Animals were deeply anesthetized with either chloroform or halothane before decapitation, in accordance with procedural guidance by the Centre Nationale de la Recherche. After isolation, the cerebellar vermis was placed in bicarbonate-buffered saline (BBS) at 2–5°C for a few minutes. Parasagittal slices (250 μm) were then cut using either a VT1000S (Leica, Nussloch, Germany) or an HM650V vibratome (Microm, Walldorf, Germany). The slicing procedure was performed in cold BBS supplemented with sucrose (100 mm) and d-(-)-2-amino-5-phosphonovaleric acid (d-APV; 50 μm). The slices were then stored at 32°C in oxygenated BBS for the rest of the experimental day. For all recordings, the slices were continuously superfused (2–2.5 ml/min) in the recording chamber with oxygenated extracellular solution. BBS contained the following (in mm): 130 NaCl, 2.5 KCl, 2 CaCl2, 1 MgCl2, 1.25 NaH2PO4, 26 NaHCO3, and 10 glucose (pH 7.4, after equilibration with 95% O2 and 5% CO2). All experiments were performed at 33–36°C.
Electrophysiology.
In the rodent cerebellum, UBCs form a heterogeneous population, as inferred by the region-specific expression of cellular markers within the vestibulocerebellar subdivisions (Nunzi et al., 2002, 2003; Sekerkova et al., 2004). To reduce possible heterogeneity sources, we thus restricted our recordings to UBCs in the ventral part of lobule X. UBCs could be identified easily in the transmitted deep red light (∼750 nm) with which slices were visualized using a CoolSnap HQ CCD camera (Photometrics, Trenton, NJ) run by MetaMorph software (Universal Imaging, Downington, PA) and mounted on an Axioskop microscope (Zeiss, Oberkochen, Germany). UBC somas were typically intermediate in size between granule and Golgi cells. Soma dimensions and a first evaluation of the capacitance of the cell in the whole cell configuration, giving values approximately comprised between 8 and 15 pF, were very reliable criteria for identifying UBCs. Nevertheless, in most recordings, either Alexa 488 (50 μm) for purely electrophysiological experiments or Alexa 594 (15 μm) for two-photon imaging ones were added to the intracellular solution to confirm the morphology of the cell.
Recording pipettes were pulled from borosilicate glass capillaries and had a resistance of 3.5–6.5 MΩ. Several intracellular solutions were used for whole-cell, patch-clamp recordings of UBCs. When either the firing pattern of UBCs or BK channel activation were examined, recordings were performed with an internal solution of the following composition (in mm): 150 KMeSO4, 4.6 MgCl2, 10 HEPES, 4 Na-ATP, 0.4 Na-GTP, 0.05 or 0.25 EGTA, pH 7.3 with KOH and final osmolarity 295–305 mOsm. For some of the experiments described in Figure 2A, K-gluconate replaced K-methylsulphate, and 1 mm EGTA was used. External solutions were supplemented with 1 μm 2, 3-dihydroxy-6-nitro-7sulfonyl-benzo[f]quinoxaline disodium salt (NBQX), 0.5 μm strychnine, 1 μm 6-imino-3-(4-methoxyphenyl)-1(6H)-pyridazinebutanoic acid hydrobromide (SR95531) to block AMPA, glycinergic, and GABAergic receptors, respectively. When specified in this study, 0.4 μm TTX was also bath applied. For the experiments shown in Figure 1, NBQX was omitted from the external solution. Here, mossy fibers were activated via a stimulation pipette placed in the granule cell layer, and the identity of the synaptic currents evoked in UBCs was confirmed by bath applying 10 μm NBQX and 50 μm d-APV at the end of the recording. Stimulation pipettes were filled with HEPES-buffered solution. Stimulation pulses were provided via a Model 2100 Isolated Pulse Stimulator (A-M Systems, Carlsborg, WA).
Figure 2.
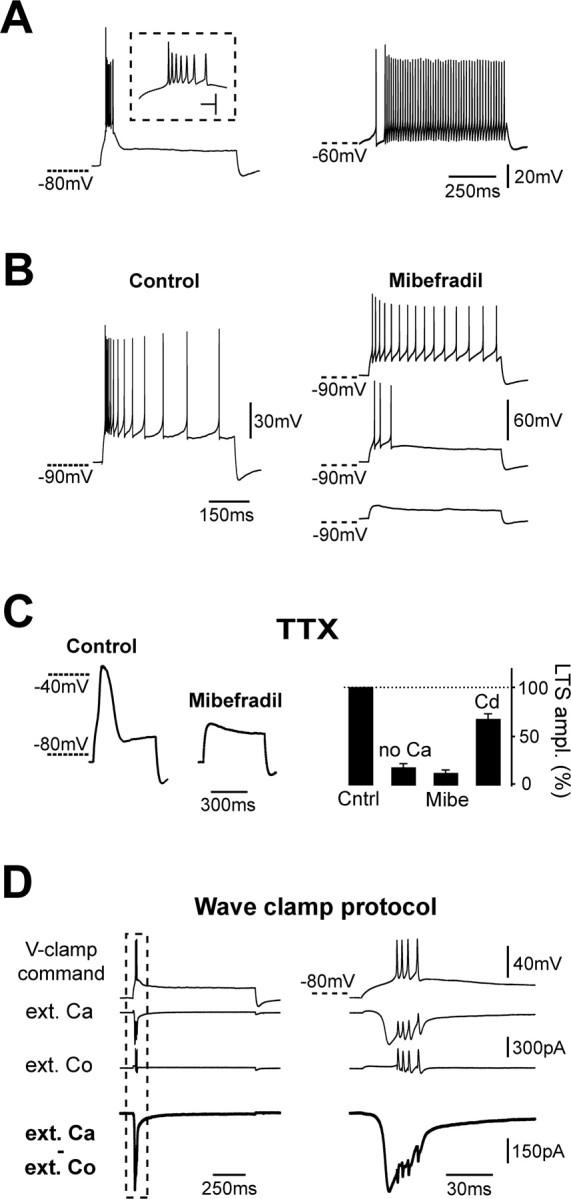
The bimodal spiking activity of vestibulocerebellar UBCs is intrinsically determined. A, Example of a current-clamped UBC showing two different voltage-dependent firing modes induced by depolarizing pulses. From hyperpolarized membrane potentials, this cell fired a burst of seven sodium action potentials at a maximum instantaneous frequency of 417 Hz (inset, left trace), riding on a slow depolarizing wave that inactivated in a few tens of milliseconds. From depolarized potentials (right trace), the cell responded to the same positive current pulse by firing tonically, on average at 96 Hz. The dashed lines show reference membrane potentials for the two cases. Calibration: (inset) 10 ms, 40 mV. B, Mibefradil eliminates the bursting behavior of UBCs. In the experiment shown here, control depolarizing current pulses produced a high-frequency burst of action potentials followed by an accommodating spiking pattern. After application of mibefradil, increasing pulses (here from bottom to top) triggered either no spikes or an accommodating pattern at low frequencies but never bursts. C, LTSs in current-clamped UBCs. TTX was present in the bath in all experiments. Application of mibefradil (MIBE) completely blocked the occurrence of LTSs, as illustrated for one experiment by the traces on the left. LTS pharmacology is shown in the right graph. Mibefradil and replacement of extracellular calcium with magnesium (no Ca) decreased LTS amplitude (ampl.) almost completely. In contrast, bath application of cadmium (Cd) reduced LTS only partially. LTS amplitude was calculated as the difference between the membrane potential at the peak, and the potential at the end of the 500-ms-long depolarizing pulses. Cntrl, Control. D, Wave-clamp experiments revealed the activation of a low-threshold calcium current and of faster calcium currents concomitantly with LTSs and sodium action potentials, respectively. The traces correspond, from top to bottom, to the command template applied in voltage-clamp conditions in this experiment, to the corresponding current recorded in extracellular TEA-BBS and extracellular calcium (ext. Ca), to the current recorded in TEA-BBS with cobalt replacing calcium (ext. Co), and finally to the subtraction of the two previous traces. The thick bottom traces thus represent the net calcium currents activating during the protocol. Part of the left traces (dashed box) were expanded for better visualization on the right. In the extracellular cobalt trace, note the presence of an outward current activating during the part of the command template corresponding to sodium spikes. This current is likely mediated by potassium conductances not completely blocked by extracellular TEA-BBS.
Figure 1.

Mossy fiber stimulation and UBC excitability. A, The typical morphology of a cerebellar UBC shown here on the left was obtained with a commercial anti-calretinin antibody. Note the single dendrite terminating with small finger-like dendrioles. The histogram on the right illustrates the distribution of the resting membrane potentials (Rest. potential) of 20 UBCs, calculated as the membrane potential while injecting no net current into current-clamped cells. In only one case, a UBC fired spontaneously (Spontan. firing). Bins in the graph cover 2 mV intervals. B, In the voltage-clamp configuration, single mf stimulation produced the typical biphasic synaptic response of UBCs. The faster component is included in the dashed box on the left, and is correspondingly time enlarged on the right. Here, the stimulation artifact was cancelled for clarity, and the time of stimulation is indicated by the black arrow. Note the different time scale. In this UBC, the faster EPSC had 76.4 pA amplitude, 269 μs rise time, and 1.9 ms decay time constant. In contrast, the slower component had 58.0 pA amplitude and 454.5 ms decay time constant. The mf response was blocked by application of NBQX and d-APV (left gray trace). Traces are averages from eight (control) and 10 (NBQX and d-APV) individual responses. C, Mossy fiber stimulation induces bursts and tonic firing in UBCs. In current clamp, a train of six stimulations at 20 Hz triggered two bursts of action potentials in this UBC from hyperpolarized voltages (top). Longer stimulation trains (2 s at 20 Hz) induced two bursts followed by individual action potentials from a membrane potential slightly more depolarized than −70 mV (middle) and a train of tonic spikes, but no bursts, from more positive potentials (bottom). In all traces, bursts are indicated with black dots. A minimum of two action potentials at frequencies higher than 100 Hz were considered as a burst. Insets represent the first burst of action potentials on the top and the response of the cell to the first mf stimulation in the middle and bottom traces. Calibration: (inset) 30 mV, 5 ms. Stimulation artifacts have been reduced digitally for clarity.
In some of the wave-clamp experiments displayed in Figures 2 and 7, 40 mm BAPTA was used in the internal solution. Changes in osmolarity were compensated for by modifying the content of K-methylsulphate. In these experiments, traces recorded from current-clamped UBCs were applied as voltage-clamp commands to the same UBCs after replacing the standard BBS with the following tetraethylammonium (TEA)-BBS solution: 130 TEA-Cl, 2 CaCl2, 1 MgCl2, 26 NaHCO3, 10 glucose supplemented with TTX, strychnine, SR95531, and NBQX. The Ca2+ currents activating during stimulation protocols were obtained as described in the Results.
Figure 7.

L-type channels mediate most of the somatodendritic Ca2+ influx during tonic firing. A, In this wave-clamp experiment, the voltage command template used is represented by the top traces in Aa. It consisted of a mixed bursting and tonic firing pattern of activity, which was previously recorded in the same UBC. The bottom traces show the currents activated by BAYK8644 (BAYK) during the voltage-clamp protocol. Note that the BAYK8644-sensitive currents reliably activated in correspondence with each imposed spike. The sweep extracts included in the dashed box on the left are shown at higher temporal resolution on the right. In Ab, the average of 50 single action potential commands (top trace), extracted from the traces illustrated in Aa, are shown with the corresponding BAYK8644-sensitive currents (bottom trace). The traces were time-locked at the peak of the spike command. Note the rapidity of current activation and deactivation kinetics and its weak activation during the slow depolarizing phase preceding the spike initiation and during the spike upstroke. B, Two-photon imaging analysis confirmed that L-type channels are present in the somatodendritic compartment of UBCs. The reconstructed morphology of the cell is shown in the top panel. Exemplary fluorescence traces before and after BAYK8644 (BAYK) application for the indicated POIs are also depicted. Each trace is an average of 30 action potential-induced transients. As shown in the bottom graphs, BAYK8644 application increased the slope of the linear dependence of ΔF/F0 on the spike rate both in the soma (top graph) and in the brush (bottom graph). Fluorescence values in the soma and the brush were calculated from the average fluorescence traces obtained by pooling all somatic and brush POIs, respectively. POI positions are indicated by the symbols in the morphological reconstruction (brush, circles; soma, squares). In this experiment, fluorescence from each POI was sampled every 1.134 ms. C, The effect of isradipine (isra) on Ca2+ transients induced by 1-s-long depolarizing steps to UBCs was examined. TTX was present in the bath. In this UBC, two-photon imaging analysis was performed only for the brush POIs shown in the morphological reconstruction of the cell. Isradipine reduced the amplitude of ΔF/F0 from 34.4 and 199.4% in the control (cntrl) to 1.6 and 8.2% for voltage steps from −57 to −47 and −2 mV, respectively. Average values in the soma and the brush from all experiments are shown in the graphs below for the same voltage steps.
For the simultaneous somatic and brush recordings described in Figure 6A, somatic whole-cell configuration was first established with an Alexa 488-containing internal solution. Under visual guidance of the whole-cell fluorescent signal, a second pipette was then approached to the brush, and the loose cell-attached configuration (LCA) was established. LCA pipettes contained either a K-methylsulphate-based internal solution or standard BBS. Analysis was performed on LCA action potential waveforms obtained by averaging >30 single traces time-locked at the peak of the corresponding action potentials. The duration of LCA action potentials was calculated at the half-width of the negative part of the curves, thus plausibly giving an evaluation of the slope of the depolarizing upstroke phase of action potentials. In LCA, recorded currents are in fact understood to mirror approximately the time derivative of the membrane potential (Barbour and Isope, 2000).
Figure 6.
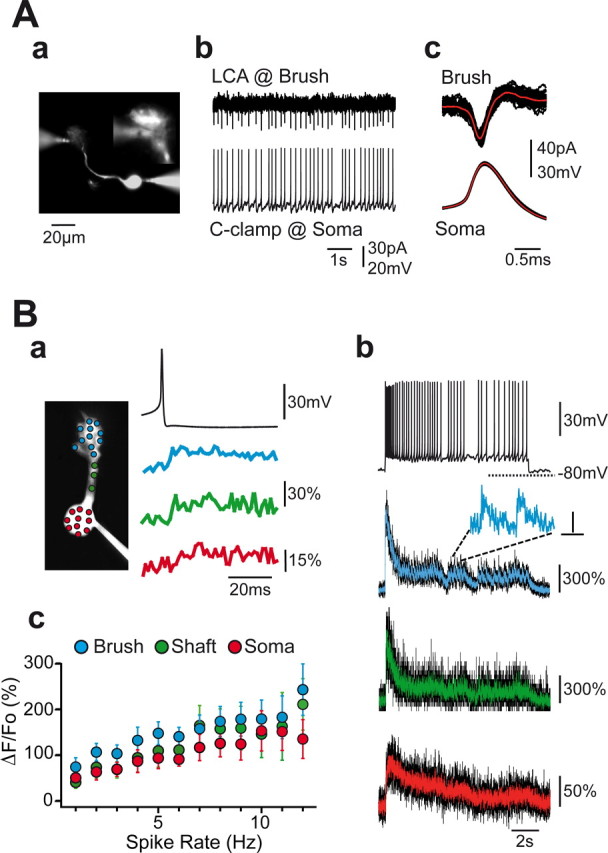
Brush excitability and Ca2+ signals in tonically firing UBCs. A, Simultaneous somatic current clamp (C-clamp) and brush LCA recordings were performed from single UBCs. One experiment is illustrated in Aa, where the morphology of the cell and the recording pipettes are shown. The inset image on the top right corner shows in more detail the contact point between the LCA pipette and the brush at a different focal plane. Here, a standard CCD camera collected the fluorescence originating from the Alexa 488-containing pipette solutions. In this UBC, the distance between the brush and the soma center was ∼50 μm. Tonic firing triggered by somatic current injection invariably induced fast signals in the LCA pipette (Ab). These resembled “classical” cell-attached action potentials. Several somatic action potentials and time-locked brush LCA traces (black traces) are illustrated in Ac with their averages (red traces; n = 56 individual sweeps). Single traces were aligned at the peak of somatic spikes. B, Two-photon imaging analysis of Ca2+ transients in tonically firing UBCs. In the experiment illustrated here, the depolarizing pulse was provided from hyperpolarized membrane potentials, such that the tonic firing period was preceded by an initial burst (Bb, black top trace). Note the huge fluorescence transient in correspondence with the spike burst in the brush (Bb, second trace from top) and the dendritic shaft (third trace) and the much smaller one in the soma (fourth trace). Single spike-induced Ca2+ augmentations during tonic firing could be easily detected in the brush after inspection of the trace, as shown at enlarged time scale in the inset by the transients corresponding to two consecutive spikes. In contrast, fast signals were revealed in the shaft and soma only after averaging several single action potential-locked fluorescence sweeps (n = 35; Ba). In this experiment, Ca2+ transients associated with tonic firing in the soma were, atypically, much smaller than in the brush and the shaft. Colored fluorescence traces in Bb are a smoothed version of the raw recordings, which are illustrated in black. POI fluorescence was sampled every 1.404 ms in this experiment. Inset bars are 75% and 20 ms. In Bc, the average ΔF/F0 as a function of the firing frequency is illustrated for all cellular compartments. Color codes are always blue for the brush, green for the shaft, and red for the soma.
Ca2+ current isolation and recording.
Several ionic conditions were tested to isolate Ca2+ conductances. The best results were obtained with an intracellular solution with the following composition (in mm): 150 N-methyl-d-glucamine (NMDG)-Cl, 4.6 MgCl2, 10 HEPES, 4 Na-ATP, 0.4 NA-GTP, 1 EGTA, pH 7.3 with NMDG. In several experiments, 10 mm Na2-phosphocreatine was added to the internal solution, and the concentration of NMDG-Cl was modified accordingly. The extracellular solution was the TEA-BBS described previously, supplemented with TTX, strychnine, SR95531, NBQX, and 2 mm CsCl to block Ih currents. In these conditions, two distinct VDCC components, a slowly (SLINC) and a fast (FINC) inactivating one, could be isolated clearly according to their voltage dependence and their kinetic properties (see Figs. 3, 4). We also performed several experiments using the following external NMDG-BBS: 130 NMDG-Cl, 2 CaCl2, 1 MgCl2, 26 NaHCO3, and 10 glucose supplemented with synaptic blockers and CsCl. With this extracellular solution, I–V curves at depolarized potentials (more depolarized than −30 mV) appeared to be contaminated by unidentified outward conductances. Reported potentials have been corrected for a junction potential of 7 mV, measured with respect to extracellular BBS.
Figure 3.
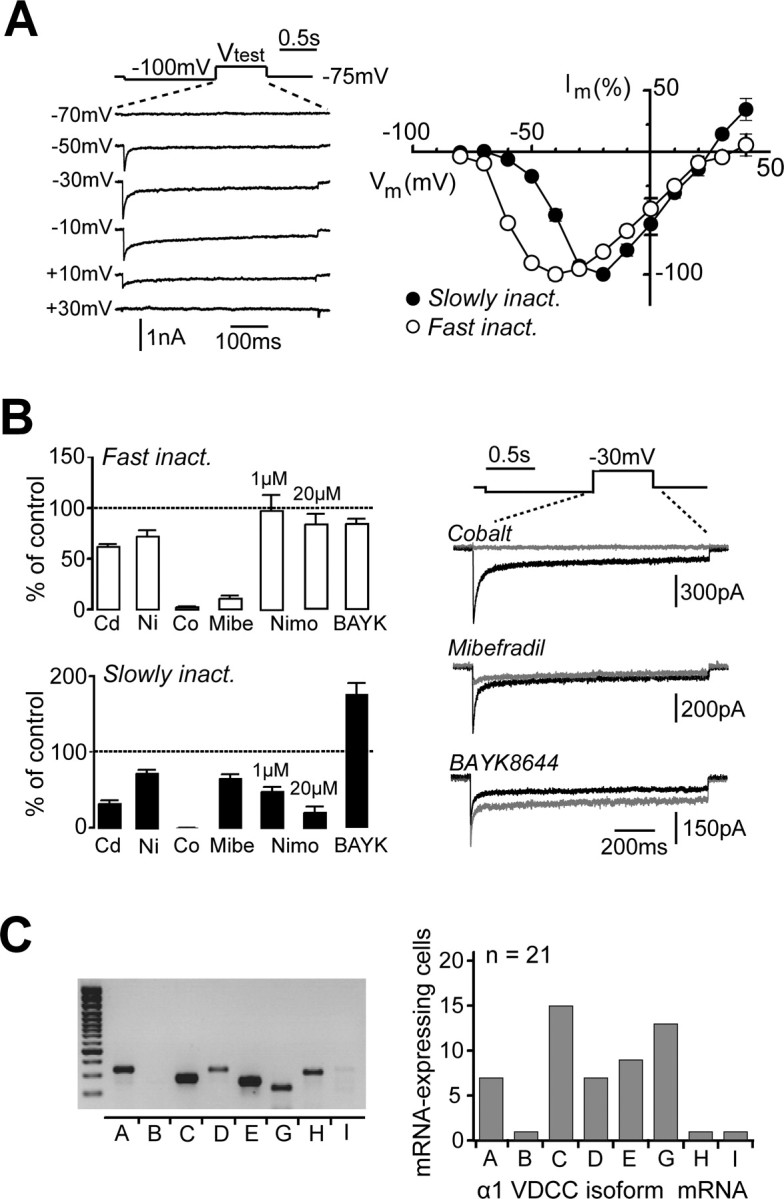
Identification of VDCCs in UBCs. A, The average I–V curves for the FINC component (Fast inact.; right, open circles) and for the SLINC component (Slowly inact.; right filled circles) from several cells are depicted. I–V curves were obtained by stepping the membrane potential of UBCs to Vtest for 550 ms after a 1-s-long deinactivating pulse to −100 mV. Sweep extracts from the I–V curve of one cell are illustrated on the left. Test potentials are indicated at the left of the corresponding sweeps. In this cell, the peak FINC was 890 pA at −30 mV, whereas the peak SLINC was 231 pA at −20 mV. Note the different dependence on the membrane potential of the two VDCC components. B, Bar graphs summarizing the results of the pharmacological analysis of FINC (top graph) and SLINC (bottom graph) in voltage-clamped UBCs. On the right, traces from three distinct UBCs illustrating the typical effect of replacing external calcium with cobalt (top traces), of bath application of mibefradil (middle traces), and BAYK8644 (bottom traces) are shown. Control traces are black, and traces recorded during drug application are gray. Note that cobalt completely inhibited both components (FINC, 3.4% of control; SLINC, 1.1%), whereas mibefradil strongly reduced FINC (12.8%) and, to a lesser extent, SLINC (75.3%). Finally, BAYK8644 potentiated SLINC (167.0%) while modifying FINC only slightly (118.2%). Cd, Cadmium; Ni, nickel; Co, cobalt; Mibe, mibefradil; Nimo, nimodipine; BAYK, BAYK8644. C, Single-cell RT-PCR testing the expression of VDCC mRNAs in UBCs. Left, Expression pattern for one UBC. In this case, the mRNAs of several VDCCs were amplified and revealed. Exceptions were the mRNAs of the α1B subunit-containing N-type channel and the α1I subunit-containing T-type channel. The first column on the left corresponds to molecular weight markers. Right, Bar graphs representing the number of UBCs, of a total of 21, in which the mRNAs of the indicated α1 subunits were revealed.
Figure 4.

A, FINC activation and inactivation properties. Aa, Sample traces of the two pulse protocols used to study FINC inactivation. After the deinactivating pulse, T-type currents were inactivated by stepping the membrane potential to Vtest for 1 s. The resulting steady-state inactivation was then studied by maximally activating T-type channels at −40 mV. Percentage current inactivation (open circles, Ab) and conductance (conduct.) activation (filled circles, Ab) curves are illustrated as a function of the membrane potential. Note the wide crossing area formed by the two curves. The recovery time from inactivation is illustrated in Ac. At the top, the protocol used is shown. After the deinactivating pulse to −100 mV, FINC was completely inactivated by a 500-ms-long step to −40 mV. After a variable time interval Δt at −100 mV, recovery was tested again at −40 mV. B, SLINC kinetic properties. Ba, Sample traces of the SLINC currents obtained at Vtest, indicated at the left side of the sweeps. Here, no deinactivating prepulse was given. Bb, Percentage conductance activation is illustrated (black circles). For comparison, the activation curve of FINC is also depicted (gray line). B, The dependence of SLINC rise times (top graph) and decay times (bottom graph) on the membrane potential is shown.
VDCCs slowly ran down in these whole-cell recording conditions, typically disappearing 20–25 min after breaking in. The steepest part of the run-down process generally started after 10 min of recording. Phosphocreatine in the internal solution improved recording stability and greatly reduced the run-down. To study VDCCs, typical protocols consisted of stepping the cell to the test membrane potential for several hundreds of milliseconds after a 1-s-long deinactivating step to −100 mV. Membrane holding potential was −75 mV. Either P/4 or P/8 subtraction protocols at 5% amplitude were applied to eliminate leak contributions to voltage-dependent currents. Test pulses for Ca2+ currents were normally given at 30 s intervals for pharmacological experiments and at 20 s intervals for I–V curves and kinetic properties characterization of VDCCs. Drug effects were evaluated on SLINC at −30 mV as test potential and on FINC at either −40 or −30 mV.
Electrophysiological experiments: data acquisition and analysis.
Electrophysiological recordings were performed via either a double EPC-10 amplifier (Heka Elektronik, Lambrecht/Pfalz, Germany) run by PatchMaster or Pulse software (Heka Elektronik) or, in preliminary experiments, a double EPC-9 amplifier (Heka Elektronic) run by Pulse. Sampling frequency was either 20 or 40 kHz for VDCC recordings and 10, 20, or 100 kHz for the other recordings. Data were filtered at 3 kHz. All data were analyzed using IGOR (WaveMetrics, Lake Oswego, OR) and with routines developed in-house. Analysis of VDCC amplitudes was performed separately on SLINC and FINC components. SLINC amplitude was calculated as the difference between the average current in the 500–550 ms interval after the start of the test pulse and the average current in a 50-ms-long prepulse interval. As for FINC, we fitted the SLINC current with a line in a several hundred millisecond-long interval at the end of the test pulse. The extrapolated value on the fitted line at the time point of maximal FINC was then subtracted from the composite (SLINC plus FINC) current value, calculated as the average current in a 600 μs period centered at the peak minus the control prepulse value. SLINC and FINC activation and SLINC deactivation times were calculated between 20 and 80% of the corresponding processes. SLINC deactivation kinetics was evaluated during the repolarization phase at the end of the 550-ms-long test pulses performed to obtain I–V curves. SLINC activation times were calculated on the current rising phase of test potential pulses performed from −55 mV as holding potential. FINC deactivation was well fitted by a double exponential function. The faster time constant, as opposed to the slower time constant probably depicting inactivation, was assumed to be the deactivation time constant. Statistical comparisons were performed using either the Mann–Whitney or the Wilcoxon ranked paired test. Statistical significance was set at 0.05. Results are given as mean ± SEM.
Two-photon imaging experiments.
All experiments were performed with a custom-built two-photon laser-scanning microscope. A detailed description of the system is provided in a manuscript in preparation (Y. Otsu, V. Bormuth, J. Wong, B. Mathieu, G. Dugué, A. Feltz, S. Dieudonné, unpublished observations). In brief, in our system, both X and Y scanning was operated by acousto-optic deflectors (AODs). These nonmechanical beam-steering devices use acoustic waves diffusing inside a crystal to diffract light, thus allowing access to individual points of interest on a biological specimen up to rates of several hundred kilohertz. The TeO2 crystal AODs, which constitute the core of our system, were custom designed by A-A Opto-Electronic (Orsay, France). Two-photon excitation was produced by an infrared Ti-Sa pulsed Tsunami laser pumped by a Millennia VI (Spectra-Physics, Mountain View, CA) and coupled to the transmitted light port of a BX51W1 microscope (Olympus, Tokyo, Japan) by a dichroic filter. The microscope was equipped with a 40× LUMPlanFL/IR objective with 0.8 numerical aperture (Olympus). Fluorescence photons were detected by a cooled AsGaP H7421–40 photomultiplier (Hamamatsu, Shizuoka, Japan). To operate the AODs and run the scanning procedures, a custom-made user interface was programmed in Labview (National Instruments, Austin, TX). Determining the appropriate acoustic wavelength in the AOD crystal deflects the laser beam to a determined position. Steady-state acoustic waveforms were generated via a Direct Digital Synthesis and a fast power amplifier from A-A Optoelectronics in <10 ns. In our experiments, we set the dwell time at each individual point of interest (POI) to 50 μs, during which the POI was illuminated and the resulting fluorescence photons were collected. Summing the user-selected dwell time to the AOD switch rate (4 μs) provided the illumination duty cycle. In our experiments, between 15 and 25 POIs were chosen on UBCs. Fluorescence sample frequencies were thus comprised between 1235 and 741 Hz. In this way, exceptionally fast biological signals could be simultaneously recorded at multiple POIs. Full images could also be acquired by performing a raster scan. As an example, the reconstruction of UBC morphology, which can be seen in Figures 5, 6, and 7, were performed by superimposing several raster scan images at 2 μm Z increments. Whole-cell recordings of UBCs were performed with an Axoclamp 2B amplifier (Molecular Devices, Union City, CA) via a Digidata 1320A interface (Molecular Devices). Recording pipettes contained the following (in mm): 150 KMeSO4, 6 NaCl, 2 MgCl, 10 HEPES, 4 ATP-Mg, 0.4 GTP-Mg, supplemented with the morphological dye Alexa 594 (15 μm; Invitrogen, Carlsbad, CA) and either Fluo-4 (200 μm; Invitrogen) or Fluo-5F (200 μm; Invitrogen) as calcium-sensitive dye. All experiments were performed at 33–36°C. When possible, brush, shaft, and somatic points in the same focal plane were chosen to monitor the structures simultaneously. Otherwise, the focal plane was modified to perform separate trials. Ca2+-sensitive dye fluorescence was typically acquired continuously while performing electrophysiological protocols. Fluorescence acquisition was routinely interrupted every 2–3 min to check the recording stability. The laser powers used in this study (typically <10 mW2) provided good signal-to-noise ratios while limiting photodamage, and optical recordings from UBCs were generally stable over >20 min. All data were analyzed using IGOR (WaveMetrics) and with routines developed in-house. For each experiment, all analysis was performed on average fluorescence traces for brush, shaft, and somatic signals obtained by pooling all POIs in the corresponding cellular compartment. For low-threshold spike (LTS)-triggered Ca2+ signals, somatic POIs were divided into two subsets, one group composed of the POIs close to the cellular membrane and the other of the POIs chosen in the center of the soma. Changes in fluorescence were evaluated by calculating ΔF/F0 = 100*(F − F0)/F0, where F0 and F were the background-subtracted average photon number at rest and the background-subtracted average photon number during the test period, respectively. Background fluorescence was acquired at a POI positioned away from dye-loaded structures.
Figure 5.

Two-photon imaging analysis of LTS-induced Ca2+ transients in UBCs. A, The morphology of the UBC examined in this experiment was reconstructed by superposing several Alexa 594 fluorescence images taken at different focal planes. TTX was present in the bath. Fluorescence from multiple POIs from both the brush (blue circles) and the soma (red circles) was simultaneously recorded. In this experiment, POI fluorescence was sampled every 1.35 ms. On the left, the Ca2+ transients induced by a single LTS (black trace on top) are shown for the brush POIs indicated by the blue lines. Note the uniformity of transient amplitude and kinetics in all of the POIs shown. On the right, the Ca2+ transients obtained by averaging all of the POIs analyzed in the brush (blue trace; avg. brush) and in the soma (red trace; avg. soma) are depicted for the same trial. Note the different amplitude in the two compartments. In this cell, ΔF/F0 after a single LTS was 660.8 ± 21.3% in the brush (n = 12 POIs; average of 4 LTS responses), 40.5 ± 2.8% in the membrane somatic region (soma memb) (n = 6 POIs), and 21.5 ± 2.5% in the somatic bulk (n = 2 POIs). Average ΔF/F0 values, 20–80% rise times, and decay time constants from all experiments are depicted in B, C, and D.
Single-cell reverse transcription-PCR.
We studied the expression patterns of eight genes encoding α1 calcium channel subunits by single-cell reverse transcription (RT)-multiplex PCR (RT-mPCR) (Christophe et al., 2005). All UBCs used for this analysis were recorded in acute slices. At the end of the experiment, the content of the cell was aspirated under visual control into the recording pipette. This operation was halted either before or as soon as the seal was lost. Patch pipettes were filled with 10 μl of a sterile-filtered and autoclaved solution containing the following (in mm): 140 KCl, 5 HEPES, 3 MgCl2, and 5 EGTA, pH 7.3. The content of the pipette was expelled into a sterile 0.2 ml test tube for reverse transcription reactions by breaking the very tip of the pipette into the tube and simultaneously applying positive pressure to the pipette. The usual volume recovered was ∼5 μl. To perform the one-step RT-PCR, this volume was brought to 20 μl with the following components at final concentrations, as follows: 0.2 μm forward primers, 0.2 μm reverse primers, 25 μl of 2× buffer of the SuperScript III One-Step RT-PCR System (containing 0.2 mm each of the four deoxyribonucleotide trisphosphate and 1.2 mm MgCl2 final concentration; Invitrogen) and 2 μl of the enzyme mixture (Superscript III RNase H– Reverse Transcriptase and Platinum Taq Polymerase). The resulting 50 μl mix was incubated for 45 min at 55°C and then submitted to 40 PCR cycles (15 s at 94°C, 30 s at 56°C, 1 min at 68°C) with an initial denaturation period of 2 min at 94°C and a final elongation of 5 min at 68°C. The PCR products were reamplified in simplex mode with a unique pair of primers. The reaction was set up as follows: 2 μl of 10× reaction buffer (yielding to 1.5 mm MgCl2 final concentration; Qiagen, Courtaboeuf, France), 0.2 μm forward primers, 0.2 μm reverse primers, 0.2 mm each of the four deoxyribonucleotide trisphosphate, 2.5 U of Taq Polymerase and water up to 20 μl. Thirty PCR cycles (1 min at 94°C, 1 min 30 s at 56°C, 1 min at 72°C) were then performed with an initial denaturation period of 3 min at 94°C and a final elongation of 10 min at 72°C. The primers used have the following sequence and are listed in the forward and reverse order: α1A, 5′-CAC TCA AGC TGG TGT CTG GA-3′ and 5′-GGA AAA CAG TGA GCA CAG CA-3′; α1B, 5′-ACA TTC GTG GTC TCT CCA CC-3′ and 5′-GAG GCG AAG GAAGCT TAG GT-3′; α1C, 5′-CCA GCC CAG AAA AGA AAC AG-3′ and 5′-ACT GCC TTT TCC TTA AGG TGC-3′; α1D, 5′-ATT GCC AGA AAA GAA AGC CTA GA-3′ and 5′-AAT GAG CTT GTG GCA ACC CAC-3′; α1E, 5′-ATG GAG ACT CGG ACC AGA GC-3′ and 5′-GGT GGC CAG GAT CAT GTA CTC-3′; α1G, 5′-GAT GGT ACC TCA CAC TGA GG-3′ and 5′-GGT TGG GAG TGA ACA GAC AA-3′; α1H, 5′-AGG ACG CAG CAG AGT TTG AT-3′ and 5′-GTT GGA GAC GCT GAG AAA GG-3′; α1I, 5′-ATG CTG GTG ATC CTG CTG AAC-3′ and 5′-GCA CGC GGT TGA TGG CTT TGA G-3′. Each PCR was run on a 1.5% agarose gel stained with ethidium bromide using a 100 bp DNA ladder molecular weight marker (Promega, Charbonnières, France). The efficiency of the RT-multiplex PCR protocol was tested on 500 pg of total RNA from rat cerebellum for each primer pair. The result of the PCR for each tested gene in all experiments was taken into account when the positive control reaction demonstrated a single major band of correct size, whereas the negative control reaction (without reverse transcriptase) generated no detectable products other than primer dimers. As a control, harvesting pipettes were briefly brushed on the slice surface, and the amplification procedure was repeated as for whole-cell recordings. All of the PCR fragments amplified from mRNA spanned at least one intron to prevent or at least identify amplification of genomic DNA.
Drugs.
Stocks of NBQX, SR95531, d-APV, TTX (Tocris Cookson, Bristol, UK), strychnine, and mibefradil (Sigma, St. Louis, MO) were prepared in water and stored at −20°C. In our experiments, mibefradil was used at a concentration of 10 μm, because, at lower concentrations, the action of the drug in the slice was too slow to warrant stable recordings. Stocks of CsCl, CdCl2, CoCl2, and NiCl2 (Sigma) were prepared in water and stored at 5°C. Stocks of isradipine, paxilline, penitrem A (Sigma), 1,4-dihydro-2,6-dimethyl-5-nitro-4-[2-(trifluoromethyl)phenyl]-3-pyridinecarboxylic acid, methyl ester (BAYK8644), and 2,5-dimethyl-4-[2-(phenylmethyl)benzoyl]-1H-pyrrole-3-carboxylic acid methyl ester (FPL64176) (Tocris Cookson) were prepared in DMSO and stored at −80°C. Nimodipine (Tocris Cookson and Sigma) was dissolved in DMSO at most 5 min before use, and the aliquot was used for a single experiment. All dihydropyridines, FPL64176, and paxilline were applied in dark-room conditions. All other drugs were obtained from Sigma.
Results
Tonic and burst firing of cerebellar UBCs in response to mossy fiber inputs
UBCs were recorded in the granule cell layer of the vestibulocerebellum. UBCs were reliably identified by the diameter of their ovoid cell body (10–20 μm), which is intermediate between that of Golgi cells and granule cells. In most cells, their distinctive morphology, a single sturdy dendrite with a paintbrush-like ending (Fig. 1A), was nonetheless confirmed on-line by fluorescence imaging after whole-cell loading of either Alexa 488 or Alexa 594.
The vast majority of the UBCs tested (19 of 20) did not discharge spontaneously at rest when recorded in the cell-attached configuration. When entering the whole-cell configuration, the resting membrane potential ranged between −57.8 and −72.9 mV and averaged −67.6 ± 0.9 mV (n = 19) (Fig. 1A, histogram on the right).
The only known source of excitation of UBCs is their single giant mossy fiber input, which can be spontaneously active at high frequencies in vivo (≫ 20 Hz) (Goldberg and Fernandez, 1971) and is thus likely to drive the complex pattern of activity of UBCs observed in anesthetized and awake animals (Simpson et al., 2005). To understand how UBCs may transcode their synaptic input, we examined the response of UBCs to extracellular stimulation of the mf. Strychnine (0.5 μm) and SR95531 (1 μm) were bath applied to block synaptic inhibition (Dugué et al., 2005). In voltage-clamped cells (holding potential, −72 mV), single mf stimulations produced a typical biphasic synaptic response (Rossi et al., 1995) (Fig. 1B). The first component of the response was a “classical” fast EPSC that had an average amplitude of 102.8 ± 19.1 pA (n = 11) (Fig. 1B, inset, right trace), rose in 0.31 ± 0.06 ms (n = 11) from 20 to 80% of the peak amplitude, and decayed with a time constant of 2.2 ± 0.3 ms (n = 11). The slower component had an average amplitude of 31.0 ± 5.5 pA, reached its maximal amplitude 163.3 ± 14.8 ms after the peak of the faster component, and showed a decay time constant of 504.1 ± 70.0 ms (n = 13). Both components were inhibited by application of the AMPA and NMDA receptor blockers NBQX (10 μm) and d-APV (50 μm), as described previously (Rossi et al., 1995).
Repetitive stimulations of the mossy fiber input were performed in the current-clamp mode (Fig. 1C). From hyperpolarized membrane potentials (approximately more negative than −75 mV), at most six mf stimulations at either 20 or 50 Hz were sufficient to induce one or more high-frequency bursts of action potentials in 10 of 14 UBCs (Fig. 1C, top). On average, bursts consisted of 3.8 ± 0.4 action potentials (range, 2–6; n = 10) at a frequency of 300.5 ± 45.7 Hz (range, 192 to 681 Hz) and with a duration of 14.3 ± 1.9 ms, calculated as the time between the first and the last occurring spike. At hyperpolarized and intermediate potentials, longer stimulations at either 20, 50, or 100 Hz (for example 2 s at 20 Hz) (Fig. 1C, middle) were able to induce short bursting periods followed by individual action potentials in five of nine cells. At depolarized voltages closer to spike threshold (approximately more depolarized than −60 mV) (Fig. 1C, bottom), repeated mossy fiber activity triggered tonic firing either during or at the end of the stimulation trains in all of the UBCs examined (11 of 11 cells). Under these conditions, in contrast, bursting activity could never be induced.
Therefore, depending on the membrane potential, the response of UBCs to physiological mossy fiber activity consists in either bursts of action potentials or in tonic firing. This property may underlie different coding strategies by the vestibulocerebellum of the information transiting via the granule cell input layer.
The intrinsic excitability of UBCs explains their bimodal firing behavior
The bursting behavior of UBCs may arise from the peculiar kinetic properties of the mossy fiber EPSC and/or from the regenerative properties of its large NMDA component (Rossi et al., 1995). Alternatively, bursting may be generated by active membrane properties. To test this second hypothesis, depolarizing current pulses were injected from various holding potentials in the current-clamp configuration (Fig. 2A). In the majority of the cells examined (129 of a total 136 cells), we found that UBCs showed two distinct firing modes. When depolarizing pulses were given from potentials close to or overlapping the threshold of the cell for sodium action potentials, they produced tonic sequences of single action potentials (Fig. 2A, right). However, when evoked from hyperpolarized potentials (approximately more hyperpolarized than or equal to −75 mV), depolarizing pulses produced a short (duration, 28.2 ± 8.1 ms; n = 21) stereotyped burst consisting of a small number of action potentials (5.2 ± 0.6; range, 2–15) at the average frequency of 277.1 ± 26.3 Hz (range, 101 to 618 Hz). Additionally, when hyperpolarizing pulses (100–500 ms long) were applied to UBCs from depolarized potentials, the vast majority of UBCs (25 of 26 cells) showed robust rebound bursts, which were sometimes followed by periods of accelerated tonic firing activity (data not shown). Thus, UBC intrinsic conductances profoundly shape their response to the mossy fiber input.
Several distinct mechanisms can produce bursts in neurons (Krahe and Gabbiani, 2004). Nevertheless, the properties of bursts in UBCs draw a direct parallel to a firing pattern present in thalamocortical relay cells, where bursts are produced by low-threshold T-type Ca2+ channels (Llinas and Jahnsen, 1982; Destexhe and Sejnowski, 2001). Consistent with this hypothesis, we found that mibefradil (10 μm) completely eliminated the capability of UBCs to produce high-frequency bursts when depolarized from hyperpolarized membrane potentials (Fig. 2B). After mibefradil application, in fact, all of the cells tested (n = 6) responded to current pulses either with subthreshold depolarizations or with sustained patterns of firing when the amplitude of the injected currents was increased (Fig. 2B, right traces). This result points to an involvement of VDCCs, and particularly of T-type channels, in triggering the bursting behavior. Mibefradil is in fact a Ca2+ channel blocker that shows a preferential, although not specific, action on T-type Ca2+ conductances (Viana et al., 1997; McDonough and Bean, 1998).
During bursts, sodium action potential discharges were sustained by a slow depolarizing wave that could be revealed by application of TTX. These LTSs (Fig. 2C, left control trace) were present in all of the UBCs tested (n = 24). They had an average amplitude of 36.5 ± 2.9 mV and a duration at half-maximum (FDHM) of 42.4 ± 6.9 ms (n = 9). We examined the pharmacological profile of LTSs, particularly the possible involvement of VDCCs. Replacing Ca2+ with magnesium decreased LTS amplitude to 18.5 ± 3.8% of the control value (p < 0.05; n = 4) (Fig. 2C, right graph), thus confirming that Ca2+ ions carry most of the current that generates burst firing and the underlying LTS. We then tested mibefradil and cadmium (50 μm) to identify the VDCCs involved. Cadmium is in fact a potent blocker of most VDCCs but not of T-type conductances (Huguenard, 1996). Application of mibefradil led to a dramatic decrease in the amplitude of LTSs to 12.8 ± 3.1% (n = 7) of the control value, whereas application of cadmium only partially decreased the amplitude of LTSs in TTX to 67.8 ± 5.3% of their control value (n = 5). These results strongly support the hypothesis of a major role of T-type channels in producing bursts in UBCs.
We then used the wave-clamp method (Fig. 2D) (Swensen and Bean, 2003) to quantify the contribution and amplitude of the Ca2+ conductances activated during a burst. UBCs were depolarized with a square current pulse. The resulting burst was recorded and transformed on-line into a voltage-clamp template. TTX (400 nm) was subsequently added to the external solution, and Na-Cl was completely replaced with TEA-Cl to reduce sodium and potassium conductances and better isolate Ca2+ currents. The burst voltage template was then replayed in the voltage-clamp mode before and after replacement of the extracellular Ca2+ ions by cobalt (2 mm), and the corresponding currents were recorded. Ca2+ currents activated by the burst were revealed by subtraction of the two traces. In eight of nine UBCs, the voltage templates evoked a slow Ca2+ current of 373.5 ± 62.0 pA activating at low-threshold (−75.4 ± 10.3 mV) and inactivating after several tens of milliseconds (FDHM, 13.9 ± 2.9 ms). Superimposed on this slow conductance, very fast Ca2+ currents (FDHM, 0.88 ± 0.14 ms) appeared in correspondence to the sodium action potential waveforms present in stimulation templates. These experiments directly confirmed the activation of a low-threshold, rapidly inactivating Ca2+ conductance during LTSs in UBCs but also revealed the presence of a faster component associated with sodium action potentials. To analyze Ca2+ signaling in more detail, we characterized the VDCCs present in UBCs.
T-type and L-type conductances dominate the fast and slowly inactivating components of calcium currents in UBCs
UBCs were recorded in the voltage-clamp configuration, and VDCCs were pharmacologically isolated (see Materials and Methods). Depolarizing voltage steps to test potentials between −80 and +40mV, given after a 1-s-long prepulse to −100 mV, evoked biphasic voltage-dependent inward currents in 55 of 58 tested UBCs. A prominent, fast inactivating component was followed by a persistent, more slowly inactivating component (Fig. 3A,B). Peak FINC and SLINC amplitudes averaged 572.4 ± 30.3 pA (n = 50) and 170.4 ± 14.9 pA (n = 43), respectively. The two components showed different dependence on the membrane potential, as shown by their average I–V curves (Fig. 3A) (n = 25). FINC activated between −80 and −70 mV and peaked at −40 mV, whereas SLINC typically activated between −60 and −50 mV and peaked at −20 mV, suggesting that they represented separate conductances.
To study the role of FINC and SLINC in UBC physiology, their pharmacological profiles were analyzed (Fig. 3B). Replacing extracellular Ca2+ with cobalt (2 mm) completely inhibited FINC and SLINC (to 2.5 ± 0.7 and 0.9 ± 0.7% of control, respectively; n = 6) (Fig. 3B, right), confirming that the recorded currents were mediated by VDCCs. Nickel (100 μm) inhibited FINC and SLINC to 73.2 ± 4.9% (n = 5) and 72.6 ± 6.0% (n = 6) of control, whereas cadmium (50 μm) decreased them by significantly greater amounts, to 62.5 ± 2.6% (n = 10) and 32.2 ± 4.7%, respectively (n = 11). The modest blocking effect of nickel and cadmium on FINC implies that neither P/Q-type, N-type, L-type (α1-C), R-type channels, nor T-type channels composed by α1-H subunits dominate this component (Tottene et al., 1996; Lee et al., 1999). Thus, a substantial part of FINC is most likely mediated by T-type conductances of either the α1-G or α1-I type.
Mibefradil inhibited FINC to 10.9 ± 3.0% of control (n = 6) and SLINC to 65.5 ± 5.9% (n = 4; p < 0.005), in agreement with a preferential contribution of T-type conductances to FINC. Finally, we examined the effect of two dihydropyridines. The L-type activator BAYK8644 (1 or 2 μm) slightly decreased FINC to 84.4 ± 5.0% of control (n = 5), whereas it strongly potentiated SLINC to 176.0 ± 14.9% of control in 9 of 10 tested cells (range, 137–229%). At the concentration of 1 μm, the L-type channel blocker nimodipine did not affect FINC (98.5 ± 15.6%; n = 9) but significantly reduced SLINC to 48.2 ± 6.5% of control (n = 12; range, 0–87%), suggesting that L-type channels play an important role in mediating the slowly inactivating component. Because inhibitory dihydropyridines affect α1-C - and α1-D-containing L-type channels with different efficacy (Xu and Lipscombe, 2001), we tested nimodipine at a higher concentration (20 μm) to assess the maximal contribution of L-type channels to SLINC. At 20 μm, nimodipine dramatically inhibited SLINC to 20.5 ± 8.2% of control (n = 6; range, 0–56%; p = 0.025 with respect to 1 μm) while affecting FINC modestly (83.6 ± 10.3%; n = 6). The small inhibitory effect of BAYK8644 and nimodipine on FINC is consistent with a known, nonspecific action of dihydropyridines on T-type channels (Randall and Tsien, 1997).
Single-cell RT-PCR was then used to confirm the molecular identity of the conductances responsible for FINC and SLINC. mRNAs from 21 UBCs were harvested, amplified, and tested for the following VDCC α1 subunits: α1-A (P/Q-type), α1-B (N-type), α1-C and α1-D (L-type), α1-E (R-type), α1-G, α1-H, and α1-I (T-type). Overall results are illustrated in Figure 3C. The expression profile of the RT-PCR products for a single UBC is shown on the left. The mRNAs of the α1-C and the α1-G subunits were detected in most UBCs (15 and 13 of 21 cells, respectively). The mRNAs of the α1-A, α1-E, and α1-D subunits occurred at lower frequency (7, 10, and 7 cells, respectively), whereas those of the other two T-type channel subunits, α1-H and α1-I, and for α1-B were detected only in one cell.
Together, these pharmacological and molecular experiments provide strong evidence that FINC is mostly generated by low-threshold T-type conductances assembled from α1-G subunits, and that SLINC is mainly mediated by L-type conductances that may be produced by a mixture of α1-C- and α1-D-containing channels. A minor contribution of R-type channels to FINC and of P/Q-type channels to SLINC cannot be completely ruled out, although their expression at the mRNA level may reflect their presence at presynaptic sites in the axon of UBCs.
FINC and SLINC biophysical properties can underlie burst and single action potential signaling
Average activation curves for FINC and SLINC, obtained by deriving conductance values from the I–V curves of each experiment, were fitted with a Boltzmann function. Threshold for FINC (measured as the point of 10% activation) was −76.3 ± 1.7 mV, and half-activation was reached at −61.0 ± 1.7 mV with a slope factor of 7.0 ± 0.4 mV (n = 7). Dependence of FINC inactivation on the membrane potential was quantified by applying a prepulse protocol (Fig. 4Aa). Half-point inactivation was reached at −79.2 ± 1.7 mV with a slope factor of 6.2 ± 1.0 mV (n = 12) (Fig. 4Ab). These values are consistent with those reported previously for T-type currents in isolated neurons (Perez-Reyes, 2003). Furthermore, a comparison of the activation and inactivation curves suggests that a window current may be present between −70 and −50 mV, thus endowing UBCs with a tonic inward current and Ca2+ entry at subthreshold potentials, similar to what has been reported in thalamocortical relay cells (Crunelli et al., 2005).
The recovery time from inactivation is a fundamental parameter governing FINC recruitment. We studied it using a two-pulse protocol (Hering et al., 2004) (Fig. 4Ac). Curves representing the time course of recovery from steady-state inactivation were fitted with two exponentials. Time constants were 48.2 ± 10.8 and 752.8 ± 206.4 ms, the faster component contributing 62.7% of the total inactivation (n = 10). Typical of T-type currents (Perez-Reyes, 2003; Iftinca et al., 2006), rise times, inactivation, and deactivation times were dependent on the membrane potential (supplemental figure, available at www.jneurosci.org as supplemental material). Inactivation rates decreased from 14.2 ± 3.0 ms at −70 mV to 9.1 ± 1.4 ms at −30 mV (n = 20; p < 0.05), whereas the 20–80% rise time decreased from 3.1 ± 0.6 ms at −70 mV to 0.7 ± 0.09 ms at −30 mV (n = 19; p ≪ 0.001). FINC currents thus presented a crossing pattern, which is distinctive of T-type conductances (Randall and Tsien, 1997). Finally, deactivation was examined by stepping the voltage command to −40 mV for 3 ms and then back to test potential. The 80 to 20% deactivation times increased from 0.4 ± 0.1 ms at −110 mV to 2.2 ± 0.8 ms at −60 mV (n = 7; p < 0.001). In conclusion, the characterization of the biophysical properties of FINC fully supports the hypothesis that this component is mediated by T-type conductances and is responsible for the LTSs observed in UBCs.
SLINC was studied by depolarizing to test potentials either from hyperpolarized holding potentials or from −55 mV, in this latter case, therefore, after almost complete inactivation of FINC (Fig. 4Ba). In the first instance, we quantified the amount of inactivation of SLINC. Inactivation, measured at the end of 500 ms depolarizing pulses, ranged from a minimum of 10.9 ± 7.9% at −50 mV to a maximum of 46.1 ± 6.2% at +20 mV (n = 19), thus confirming the persistent nature of SLINC. SLINC activated at significantly more positive membrane potentials than FINC (Fig. 4Bb). Average 10% activation was at −47.2 ± 2.4 mV (n = 14; p ≪ 0.01 with respect to FINC), whereas half-activation was reached at −28.6 ± 2.0 mV (p < 0.01) with a slope factor of 8.4 ± 0.9 mV (0.05 < p < 0.1). SLINC was characterized by fast rise times (Fig. 4Bc, top) and decay times (Fig. 4Bc, bottom), consistent with the fast kinetics reported for L-type channels (Liu et al., 2003; Helton et al., 2005). The 20–80% rise time was 0.9 ± 0.2 ms at −20 mV (n = 9), whereas the 80–20% decay time was 0.7 ± 0.1 ms at −20 mV (n = 11). Thus, although FINC would promote Ca2+ entry during burst firing, the fast activation and deactivation kinetics of SLINC suggest that this component may support action potential-dependent entry into UBCs during periods of tonic firing.
T-type channels located in the dendritic brush mediate strong calcium signaling during LTSs
Understanding the subcellular localization of Ca2+ channels in UBCs is essential, because their somatodendritic compartment has a complex organization endowed with both presynaptic and postsynaptic functions (Mugnaini et al., 1997). We used ultrafast, AOD-based two-photon imaging to map the spatial and temporal distribution of Ca2+ influx during the two functional states of UBCs with submicrometer and submillisecond precision (Salomé et al., 2006).
UBCs were patch clamped in the presence of strychnine, SR95531, NBQX, and TTX and loaded with the Ca2+-sensitive dye Fluo-4 (200 μm) and with the morphological dye Alexa 594 (15 μm). Fluorescence was monitored at a high-frame rate at specific locations or POIs (see Materials and Methods) that were chosen in the tuft, the dendritic shaft, and the cell body (Fig. 5A). To check for possible spatial heterogeneity of the somatic Ca2+ signals, somatic POIs were pooled into different subsets: membrane and central POIs.
LTSs triggered large Ca2+ increases in UBC brushes, in amplitude averaging 556.9 ± 64.1% (n = 8) (Fig. 5B). In both somatic subdivisions, in contrast, the amplitude of LTS-associated transients were significantly smaller than in the brush, amounting to 130.7 ± 33.3% (n = 7) and to 86.2 ± 24.3% (n = 7) in the membrane and central somatic regions, respectively (p < 0.01 in both cases with respect to the brush; p < 0.05 between membrane and central soma). LTS-associated Ca2+ transients were highly stereotyped, showing little variability inside single cells (average coefficient of variation: brush, 0.13 ± 0.03, n = 7; somatic membrane, 0.19 ± 0.05, n = 6) and shared the all-or-none nature of LTSs. Moreover, the Ca2+ transients were also completely prevented by application of mibefradil (n = 3). Thus, T-type calcium channels were likely responsible for the Ca2+ signals triggered by LTSs.
In the brush, the transients had a fast 20–80% rise time of 23.1 ± 2.6 ms (n = 8) (Fig. 5C) and decayed with a time constant of 552 ± 120 ms (n = 8) (Fig. 5D). The rise times of membrane somatic signals showed no significant differences with brush values, amounting to 26.0 ± 6.3 ms, whereas the decay time constant was remarkably slower, 1553 ± 477 ms (n = 7; p < 0.01; Wilcoxon test). In contrast, bulk somatic transients were both slower in rising, 58.9 ± 4.5 ms (n = 7), and in decaying, 1954 ± 467 ms (n = 7), than brush and membrane somatic transients (p < 0.01, in all cases).
In a separate set of experiments, Fluo-4 was replaced by its lower-affinity analog Fluo-5F (200 μm) to test for saturation of the dye and for the influence of the buffering power on the kinetics of the transients. The amplitude difference between brush and somatic transients was qualitatively preserved (brush, 278.0 ± 72.1%, n = 3; soma membrane, 95.1 ± 26.6%, n = 4; soma bulk, 91.7 ± 27.0%, n = 3), showing that the lower somatic values in Fluo-4 did not result from dye saturation. Brush and bulk somatic rise times were similar to the values obtained in the Fluo-4 experiments (brush, 17.9 ± 6.6 ms, n = 3; soma membrane, 20.4 ± 3.7 ms, n = 3; soma bulk, 50.7 ± 27.1 ms, n = 3). This suggests that the rise times in the brush and membrane soma reflect the real kinetics of the Ca2+ influx. All decay times were approximately three times faster than in Fluo-4 (brush, 183 ± 26 ms, n = 3; soma membrane, 593 ± 42 ms, n = 4; soma bulk, 809 ± 308 ms, n = 2), indicating that Ca2+ extrusion is instead linearly related to the buffering power of the dyes.
Together, the above results suggest the presence of a remarkably high density of T-type channels in the brush of UBCs, also raising the interesting possibility that LTSs may be directly initiated in this compartment. T-type channels might also be expressed at lower density at the somatic membrane, as suggested by the fast kinetics of the Ca2+ signals. In this regard, nonetheless, we cannot exclude that other VDCCs may make a significant contribution to Ca2+ transients at the peak of LTSs, thus producing an overestimation of the contribution of T-type channels.
Action potentials propagate into UBC brushes
In many neurons, action potential backpropagation in the dendrites is a regulated phenomenon that plays a central role in the physiology of the cell (London and Häusser, 2005). We examined to what degree action potentials invade the brush of UBCs in physiological conditions.
Simultaneous recordings were obtained in the whole-cell current-clamp mode at the soma and in the LCA mode either at the soma or at the brush (Fig. 6A). In all of the cells, sodium action potentials at the soma were time-locked with fast current signals in the LCA electrode at the brush (Fig. 6Ab) without any sign of failure. Currents recorded in LCA are generally assumed to represent the time derivative of the local membrane potential, but these fast signals are filtered by the recording circuit (Barbour and Isope, 2000) in such a way that LCA signals do not provide precise information on their intracellular equivalent. We therefore used the action currents recorded in LCA at the soma, where a full-blown spike occurs, as a reference template. The FDHM of the brush (319 ± 33 μs; n = 5) and somatic (320 ± 30 μs; n = 4) LCA signals were not significantly different (p > 0.1), although they were significantly longer than the derivative of whole-cell action potentials (brush, 160%; soma, 139%). Because of their morphology, a stout (5–50 μm long), and unramified dendritic shaft, UBCs are electrotonically compact cells, as suggested previously (Rossi et al., 1995). Nevertheless, fast depolarizations like action potentials should encounter substantial filtering (1 ms for a 50 MΩ dendrite and 20 pF brush). The speed of the LCA signal at the brush suggests that action potentials propagate into the dendrites of UBCs without major distortions.
Action potential firing evokes phasic and tonic calcium influx in the brush and soma of UBCs
To determine whether action potentials were associated with Ca2+ signaling in the brush, we mapped Ca2+ transients associated with tonic firing in current-clamped UBCs during 10-s-long depolarizing pulses using two-photon microscopy (Fluo-4). In most cases, pulses were delivered from potentials comprised between −65 and −55 mV. In a few cells, current pulses were provided from membrane potentials more negative than −75 mV (Fig. 6Bb). In both conditions, voltage and fluorescence traces falling into the first 2 s of the depolarizing pulses were excluded from analysis to avoid contaminations from T-type conductances. Increases in intracellular Ca2+ were associated with action potentials in all of the cells (n = 12). The fluorescence increases were composed of a sustained component and of fast transient signals associated with the action potentials, which were evident in some of the cells after inspection of the traces (see brush trace in Fig. 6Bb). Fast transients were better revealed by action potential-triggered averaging of fluorescence signals and were present in all of the cellular compartments (Fig. 6Ba). AOD-based two-photon imaging yielded high-frame rates that made it possible to follow the exceptionally fast rise times (20–80%) of these signals: 2.2 ± 0.8 ms (n = 8) in the brush and 1.9 ± 0.7 ms (n = 3; p > 0.1) in the dendritic shaft. Rise times at the soma were slower, 11.7 ± 3.3 ms (n = 6; p = 0.05 with respect to the brush; p < 0.03 with respect to the shaft), although still faster than LTS transients. The decay time constants at the brush (68.7 ± 6.8 ms; n = 7), shaft (71.2 ± 17.0 ms; n = 3), and soma (110.9 ± 22.4 ms; n = 5) were not significantly different (p > 0.05, in all cases).
The percentage increase in fluorescence as a function of the spike rate of the cell was analyzed by averaging values over 1 s bins. In all cellular compartments, the fluorescence was linearly related to the firing frequency up to ∼15 Hz (Fig. 6Bc). The slopes (ΔF/F0 per spike) were similar (p > 0.05, in all cases) in the brush (11.1 ± 2.4%; n = 12), dendritic shaft (10.0 ± 3.0%; n = 7), and soma (7.6 ± 1.7%; n = 12). At higher firing rates, sublinearity prevailed, most likely resulting from dye saturation. Interestingly, linear regressions crossed the y-axis at 80.2 ± 16.9% in the brush (n = 12), 47.5 ± 19.2% in the shaft (n = 7), and 55.7 ± 16.6% in the soma (n = 12), indicating the presence of sustained, action potential-independent Ca2+ influxes mediated by Ca2+ channels tonically activated during sustained spiking.
In conclusion, we have shown that electrical propagation of the action potential in the dendritic brush activates transient Ca2+ conductances, which mediate short-lasting Ca2+ influx. In contrast to T-type channels, these conductances appear distributed uniformly over the entire brush, dendritic shaft, and somatic membrane.
Do action potentials activate L-type currents?
We investigated the nature of the Ca2+ conductances activated in the tonic firing regime. Wave-clamp and imaging experiments revealed that fast Ca2+ currents are associated with action-potential and tonic depolarization in the soma and the brush. We tested whether L-type channels, which carry most of the slowly activating Ca2+ conductances, may indeed underlie Ca2+ currents during single action potentials by using wave-clamp protocols. Ca2+ currents were pharmacologically isolated, and voltage command templates representing either periods of tonic firing or of mixed bursting and tonic firing (Fig. 7Aa) were applied to UBCs. We recorded the evoked currents before and after the application of the L-type channel activator BAYK8644 (3 μm). Current subtraction revealed that BAYK8644-sensitive L-type currents reliably activated concomitantly with each individual action potential (Fig. 7A). L-type currents started to activate slowly either just below threshold or on the rising phase of action potentials (Fig. 7Ab, average traces), peaked on the falling phase of action potentials, and typically deactivated within 3 ms. With Ca2+ as permeant ion BAYK8644 increases channel conductance shifting the activation curves of L-type channels toward more negative potentials but modifying neither activation nor deactivation kinetics (Tavalin et al., 2004). Therefore, these experiments cannot provide accurate information about the physiological values of activation of L-type currents. Nevertheless, they indicate that L-type currents may provide Ca2+ entry into tonically firing UBCs. This interpretation is strongly supported also by the finding that rapid activation kinetics allow L-type conductances to activate reliably in expression systems during action potential-like depolarizations (Liu et al., 2003; Helton et al., 2005).
Finally, using this experimental approach, we could confirm that dihydropyridine antagonists are not effective blockers of L-type channels activated concomitantly with individual action potentials (Helton et al., 2005), because no consistent results could be obtained by studying the effect of either nimodipine or isradipine (3 μm).
L-type channels support the phasic and tonic calcium influx into the brush and the soma of tonically firing UBCs
To study the location of L-type channels, we assessed the sensitivity of the somatodendritic Ca2+ transients to dihydropyridines via two-photon imaging. First, we analyzed the effect of the L-type activator BAYK8644 (3 μm). The linear dependence of ΔF/F0 on the spike rate was compared before and after application of BAYK8644. In five of seven UBCs, application of BAYK8644 produced an increase of the Ca2+ signals associated with action potentials. In these five experiments, at 5 Hz spike rate, ΔF/F0 increased to 177.1 ± 16.2% of the control in the brush and to 190.5 ± 15.4% of the control in the soma. An example is given by the cell shown in Figure 7B, where BAYK8644 produced a clear increase in the slope of the linear dependence of ΔF/F0 on spike rate along the whole range of frequencies tested. In the two experiments where BAYK8644 application did not increase spike-related transients, it nevertheless induced huge increases in basal fluorescence levels. In one cell, this led to a complete shunting of the spikes and in the other cell to an apparent decrease of ΔF/F0 associated with firing. Large increases in intracellular Ca2+ were also induced in two additional UBCs by the nondihydropyridine L-type channel agonist FPL64176 (3 μm). Here, again, the strong increases in Ca2+ conductance completely shunted the sodium action potentials, so that a quantitative comparison of the effect of the drug with respect to the control could not be performed.
We then examined the effect of L-type channel antagonists. As we mentioned previously, dihydropyridines blockers are not effective on action potential-activated L-type conductances (Helton et al., 2005). We thus studied the effect of isradipine (3 μm) on Ca2+ transients induced by depolarizing steps (Fig. 7C) to −47 mV and to −2 mV from a holding membrane potential of −57 mV in the presence of bath applied TTX. Either Fluo-4 or Fluo-5F was used as Ca2+-sensitive fluorescent dyes. Average ΔF/F0 values in the time interval comprised between 150 and 250 ms after the beginning of the test pulses were compared before and after drug application. At −47 mV, ΔF/F0 increases were inhibited to 19.8 ± 7.8% in the brush (n = 7; p < 0.05) and to 16.9 ± 9.2% in the soma (n = 6; p < 0.05) with respect to the control, whereas at −2 mV, ΔF/F0 increases were reduced to 28.5 ± 5.4% in the brush (n = 7; p < 0.05) and to 26.8 ± 4.0% in the soma (n = 6; p < 0.05). These results strongly support the view that L-type channels are present in the somatodendritic compartment of UBCs and that, in this area, they support the majority of the Ca2+ entry associated with tonic depolarizations.
Calcium channels regulate the excitability of UBCs in the tonic mode
VDCCs can control neuronal excitability in opposite ways. Ca2+ currents can indeed support and amplify depolarizations either directly or via Ca2+-regulated inward currents (Crunelli et al., 2005). Alternatively, VDCCs can activate hyperpolarizing conductances, like Ca2+-dependent potassium currents, which help dampen the firing activity of the cell (Sah and Faber, 2002; Swensen and Bean, 2003). The net effect of blocking VDCCs is thus likely dictated by the balance between these contrasting effects and may vary between individual neurons. To examine to which extent VDCCs determine UBC excitability during sustained depolarizations, we tested the effect of cadmium (50 μm) on tonically firing cells. In six of seven tested UBCs, cadmium had a profound, although extremely variable, effect. In 50% of the cells, the firing frequency was in fact strongly inhibited to 55.2 ± 12.8% of the control (n = 3) (see experiment in Fig. 8A), whereas the spike rate increased to 262.2 ± 123.5% of the control in the remaining group of cells. Overall, cadmium decreased the amplitude of the action potentials (from 72.6 ± 6.6 to 64.3 ± 7.6 mV; p = 0.02, Wilcoxon test; n = 6), it increased the spike FDHM (from 368 ± 58 to 447 ± 95 μs; p = 0.04), and modified dramatically the properties of the action potential-induced afterhyperpolarization (AHP), in particular decreasing its fast phase (from 24.6 ± 1.7 to 15.6 ± 1.8 mV; p = 0.02) (Fig. 8A, sample traces). In contrast, no change was detected in the spike threshold (−42.8 ± 2.6 mV in the control, −42.7 ± 3.7 mV in the test period; p ≫ 0.05). These results suggest that VDCCs do shape UBC excitability during tonic activity. Interestingly, the contrasting actions of cadmium also suggest a degree of heterogeneity in the population of UBCs studied, which the analysis of VDCCs did not reveal. In an additional series of experiments, we attempted to study the contribution of L-type channels on UBC excitability. Unfortunately, application of nimodipine (20 μm) did not produce consistent modifications in the excitability properties of tonically firing UBCs, a fact likely attributable to the ineffectiveness of dihydropyridine antagonists in blocking action potential-triggered activation of L-type conductances (Helton et al., 2005).
Figure 8.
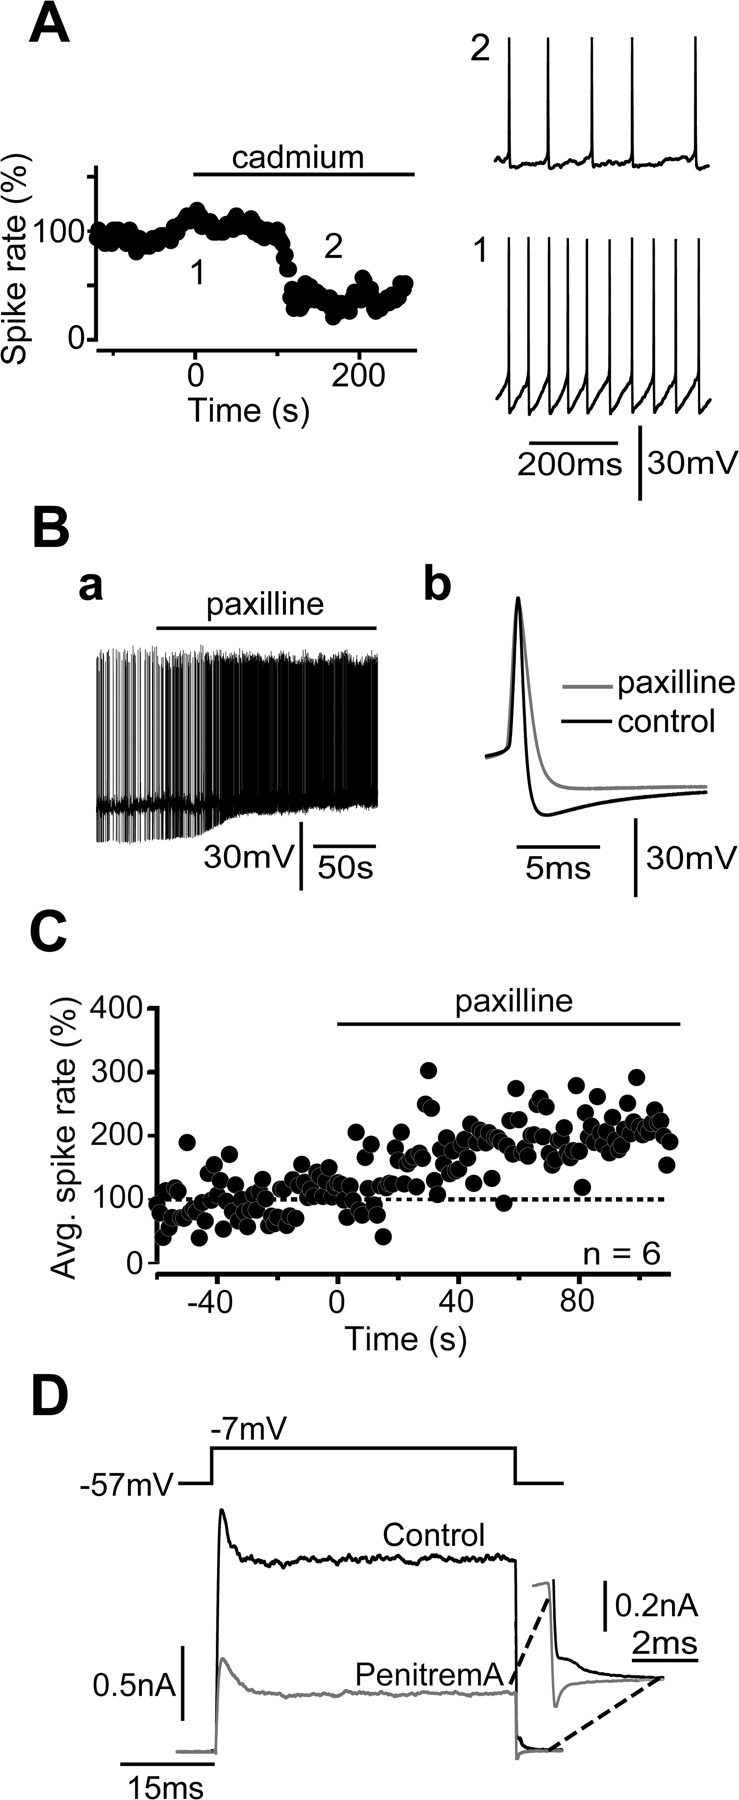
VDCCs shape UBC excitability during tonic firing. A, Cadmium (50 μm) dramatically modifies the excitability properties of UBCs. In the experiment shown here, application of cadmium reduced the spike rate from 18.0 to 7.2 Hz, with concomitant reduction of the spike amplitude (from 52.7 to 47.7 mV) and the maximal AHP (from 17.5 to 6.9 mV) and increase of the spike FDHM (from 695 to 921 μs). Sample sweeps from the control (1) and the test (2) periods are shown on the right. In the graph on the left, spike rates were averaged in 1-s-long bins. The reduction of the AHP strongly suggests that Ca2+-dependent potassium conductances are activated by single spikes. This effect on the AHP was reliably induced by cadmium in most cells, whereas the reduction of the spike rate was noticed in only 50% of the tested UBCs. In the remaining group, the spike rate increased. B, BK potassium channel activation in tonically firing UBCs. In Aa, an extract of the continuous recording of a tonically firing UBC before and during paxilline application is shown. Both the decrease of maximal AHP (from 25.5 to 14.1 mV) and the dramatic increase of the firing frequency (from 1.6 to 8.1 Hz) are evident. Similar results were obtained in the case of another UBC, which is depicted in Ab by the superposition of average action potential traces in the control (black) and after paxilline application (gray; both traces are averages of 26 sweeps). In this cell, the spike rate increased from 4.7 to 6.4 Hz, and the spike FDHM augmented from 0.54 to 0.99 ms, whereas the AHP amplitude decreased from 26.8 to 16.6 mV. The AHP amplitude was calculated as the membrane potential difference between the spike threshold and the following maximal hyperpolarization. C, The graph depicts the increase of the firing frequency with time after paxilline application. Spike frequencies in 1-s-long bins were calculated for each experiment, considering paxilline application as t = 0. Corresponding bins from five experiments were then averaged and shown here as a function of time. Error bars were omitted for clarity. D, Voltage-clamp quantification of the amount of BK current present in UBCs. The effect of the BK channel blocker penitrem A was studied on the outward current produced by depolarizing UBCs from −57 to −7 mV. In this case, penitrem A reduced the outward current by 943.1 pA. Note the decrease of the current during the repolarizing phase, as shown in the inset on the right. Avg., Average.
We then examined in more detail the effect of blocking VDCCs on the fast phase of the AHP. In neurons, this component is generally mediated by Ca2+-dependent BK potassium channels. We therefore used the BK channel blocker paxilline (10 μm) to examine the possible presence of BK potassium conductances in UBCs. Paxilline application affected the shape and frequency of action potentials in tonically firing UBCs. First, the fast AHP was reduced from 23.9 ± 2.0 to 16.1 ± 1.5 mV (n = 6; p < 0.05) (Fig. 8B). Second, action potential FDHM increased from 499 ± 30 to 691 ± 69 μs (n = 6; p < 0.05) (Fig. 8Bb). Finally, spike frequency was significantly augmented to 236.2 ± 74.8% of the control (n = 5; p < 0.05), whereas no change in spike threshold was detected (−41.9 ± 1.8 mV in the control and −40.8 ± 2.3 mV in paxilline; n = 6). To quantify the BK potassium currents expressed by UBCs, voltage-clamped cells were depolarized from −57 to −7 mV for 50 ms in the presence of synaptic blockers and TTX. The effects of the BK channel blockers paxilline and penitrem A (10 μm) on the outward currents were examined (Fig. 8D). Paxilline and penitrem A inhibited 925.6 ± 191.6 pA of the outward currents (n = 6 of 8 cells), which represents an outstanding amount of current for such small cells as UBCs.
These results indicate that Ca2+ channels are important actors in defining UBC cellular excitability even during periods of sustained depolarizations. This is accomplished, at least in part, via the direct control of BK potassium channels.
Discussion
To understand how information is processed in a brain region, it is crucial to determine the intrinsic properties of the neurons composing the circuitry. We examined the UBCs, glutamatergic interneurons participating in the computation of the vestibular input to the cerebellum. We have shown, in particular, that the distinct Ca2+ signaling systems, which are associated with the functional states present in UBCs, control their excitability and their responses to synaptic inputs. The use of complementary investigative strategies, together with the unique morphology of UBCs, has revealed the identity and the subcellular localization of the main VDCCs of these cells, thus providing the first functional characterization of their somatodendritic compartment.
Bursts and VDCCs
Approximately 95% of the UBCs examined fired high-frequency bursts of action potentials. Bursting is a long-known feature of many neurons (Llinas and Jahnsen, 1982) and can arise from several biophysical mechanisms. Reported scenarios include both “ping-pong” reverberations between somatodendritic conductances (Mainen and Sejnowski, 1996) and interactions between somatic Na+ and K+ conductances (D'Angelo et al., 2001). The paradigmatic example of bursting cells is, nonetheless, represented by thalamocortical neurons (Destexhe and Sejnowski, 2001), where bursts are triggered by low-threshold, α1-G subunit-containing T-type Ca2+ channels (Crunelli et al., 1989; Kim et al., 2001). Several elements indicate that this is the case of UBCs. First, single-cell RT-PCR reveals the expression of α1-G mRNA in most cells, consistently with its reported enrichment in the vestibulocerebellum (Talley et al., 1999). Second, the pharmacological profile of LTSs (Fig. 2) and of the fast-inactivating VDCC component (FINC) (Fig. 3) supports the hypothesis that T-type channels generate the high-frequency bursts. Finally, the voltage-dependent properties of FINC are distinctive of T-type currents (Perez-Reyes, 2003; Iftinca et al., 2006). Thus, UBCs express functional T-type channels, and these define their bursting properties.
Identity of the slowly inactivating calcium currents
We demonstrated that UBCs exhibit VDCCs producing slowly inactivating currents (SLINC) with higher activation threshold than FINC (Figs. 3, 4). The overlap of FINC activation and inactivation curves suggests that full steady-state inactivation of T-type channels is not achieved between −70 and −50 mV (Fig. 4Ab). T-type conductances might thus provide a significant contribution to SLINC at subthreshold potentials. Nevertheless, the sensitivity to dihydropyridines clearly indicates that SLINC is principally carried by L-type channels. According to single-cell RT-PCR analysis, UBCs express both α1-C and α1-D subunits (Fig. 3C), although, in contrast with the homogeneity of our pharmacological analysis, some cells did not show a positive amplification. This might be attributable to either a particular sensibility of these mRNAs to degradation or to their possible compartmentalization in the brush, which contains a rich apparatus for protein synthesis (Mugnaini et al., 1997) and a high density of VDCCs (Figs. 5, 6).
α1-C subunits typically generate high-threshold currents with high sensitivity to cadmium and dihydropyridines (Xu and Lipscombe, 2001). In contrast, α1-D subunits form low-threshold channels that are relatively cadmium- and dihydropyridine-insensitive (Avery and Johnston, 1996; Platzer et al., 2000; Xu and Lipscombe, 2001). SLINC properties are thus consistent with α1-D subunits mediating a significant fraction of the current. However, the distinction between L-type subunits in neurons is complicated by several factors. The voltage dependence of L-type channels is, in fact, sensitive to the concentration and identity of the carrier ion (Xu and Lipscombe, 2001). Furthermore, auxiliary subunits, modulation by second-messengers, and alternative splicing may affect the properties of the channels. Finally, we cannot exclude the presence of α1-F subunits, which also generate relatively low-threshold and dihydropyridine-insensitive L-type conductances (Koschak et al., 2003; McRory et al., 2004).
The rapid kinetics of L-type conductances is consistent with a major role of these channels during spike-triggered Ca2+ influx (Liu et al., 2003; Helton et al., 2005). Therefore, it is likely that the role of L-type channels in supporting fast Ca2+ signals has been underestimated thus far (Yasuda et al., 2003; Hoogland and Saggau, 2004) because of the ineffectiveness of dihydropyridines in contrasting L-type channel activation on rapid time scales. Our experiments show that L-type channels produce most of SLINC and of the Ca2+ influx at depolarized potentials. Furthermore, BAYK8644 reveals an L-type channel component associated with individual action potentials (Fig. 7). We therefore propose that L-type channels are the main players of the somatodendritic Ca2+-signaling system of UBCs during periods of sustained firing.
Brush excitability and role of dendritic Ca2+ signaling
Mapping of Ca2+ influx into UBCs with submicrometer and submillisecond resolution was achieved with AOD scanning (Shoham et al., 2005; Salomé et al., 2006). Imaging experiments suggest high densities of T-type channels in the brush, where huge transients are associated with LTSs (Fig. 5). The rise times of the submembrane somatic and of the dendritic transients are comparable, indicating that T-type channels may be present in the soma, although at lower densities as suggested by the smaller amplitude of the signals. Unfortunately, the difference in the surface to volume ratio between the brush and the soma does not permit more precise quantifications.
In contrast, individual action potentials trigger fast Ca2+ influx over the entire somatodendritic membrane. The exceptional rapidity of the brush signals supports the view that action potentials propagate into the dendritic compartment, as LCA recordings also indicate (Fig. 6A). The Ca2+ influx during tonic firing affects excitability by triggering activation of BK conductances, which likely occurs along the whole somatodendritic compartment because of the widespread distribution of the spike-associated transients. L-type channels plausibly perform the coupling between Ca2+ and BK channels (Berkefeld et al., 2006). This is also suggested by the powerful shunt that, in some cases, we observed after pharmacological potentiation of L-type currents.
The brush is the presynaptic compartment of dendrodendritic synapses with granule cells (Mugnaini et al., 1997). Thus, any dendritic Ca2+ influx likely affects release at these synapses. Importantly, in several cells, a strong correlation between subthreshold membrane potential variations and Ca2+ increases was observed in the brush, suggesting that subthreshold Ca2+ influx does occur (data not shown). This component might allow release in the absence of full spikes and could represent an important mechanism either for forwarding information to granule cells or for setting basal excitability. The linear relationship between firing rate and Ca2+ may instead code for a linear input–output relationship at the dendrodendritic contact. Interestingly, in this regard, low-threshold L-type channels support transmission in neurons where release is controlled by graded changes of the membrane potential (Brandt et al., 2003; Habermann et al., 2003).
In addition to the possible roles of Ca2+ discussed above, the powerful Ca2+-signaling system of UBCs may also control a host of other events. For example, Ca2+ may either produce long-term changes of the intrinsic excitability by modulating BK channels, as in secondary vestibular neurons (Nelson et al., 2003), or control the insertion cycle of receptors into postsynaptic densities (Malinow and Malenka, 2002), thus modifying synaptic efficacy. Finally, L-type channels may be particularly effective in mediating activity-dependent changes in gene expression and thus adaptive neuronal responses (Bading et al., 1993; Sekerkova et al., 2005).
Bimodal excitability patterns and physiological functions
Because of their all-or-none nature, bursts have been associated with states where the accurate transmission of sensory information is hampered (Steriade et al., 1993). This view is now challenged in several awake animal models, where bursts help detect stimuli related to behaviorally important events (Krahe and Gabbiani, 2004). UBCs have been recorded in in vivo conditions only recently. In anesthetized rats, most cells displayed a regular firing pattern, with just a few firing bursts, whereas in awake rabbits, only data from regular firing cells were discussed (Simpson et al., 2005). Whether bursts in UBCs are physiologically relevant is therefore still an open question. Nevertheless, burst firing is generally regarded as a highly effective mechanism for relaying synaptic information (Krahe and Gabbiani, 2004). We can then suppose that bursts in UBCs could efficiently amplify vestibular sensory signals to granule cells, evoking high-frequency action potentials (Chadderton et al., 2004) and influencing integration and plasticity at their synapses onto Purkinje cells.
At the resting potential, a considerable fraction of T-type channels (∼20%) is not inactivated, a fact allowing the mf input to trigger bursts from relatively depolarized levels (Fig. 1C). Nevertheless, several mechanisms may lead to further deinactivation. Inhibitory inputs from Golgi cells may produce hyperpolarizations (Dugué et al., 2005) and T-type channel-mediated rebounds. Alternatively, UBCs may experience periods of scarce excitatory input, and thus hyperpolarize, when the firing frequency of primary vestibular afferents is reduced from background levels by sensory stimulations (Fernandez and Goldberg, 1971; Goldberg and Fernandez, 1971). This situation would be similar to slice conditions, where UBCs and their excitatory input are typically quiescent.
Functionally, rebound bursts could signal specific patterns of head acceleration, velocity, and position in the gravitational field. Alternatively, T-type channels may perform other voltage-dependent amplifications, such as at the transitions from down to up states during slow oscillations (Crunelli et al., 2005). In this regard, it is particularly interesting to note that, in vivo, UBCs can display abrupt transitions from periods of regular firing to periods of quiescence (Simpson et al., 2005).
Footnotes
This work was supported by the Fondation pour la Recherche Médicale (M.A.D., Y.O.), the Région Ile de France (M.A.D.), and the Human Frontier Science Program (Y.O., S.D.). We thank Drs. Philippe Ascher, Boris Barbour, Anne Feltz, Philippe Isope, Alain Marty, and Eric J. Schwartz for comments on this manuscript.
References
- Altman J, Bayer SA. Time of origin and distribution of a new cell type in the rat cerebellar cortex. Exp Brain Res. 1977;29:265–274. doi: 10.1007/BF00237046. [DOI] [PubMed] [Google Scholar]
- Avery RB, Johnston D. Multiple channel types contribute to the low-voltage-activated Ca2+ current in hippocampal CA3 pyramidal neurons. J Neurosci. 1996;16:5567–5582. doi: 10.1523/JNEUROSCI.16-18-05567.1996. [DOI] [PMC free article] [PubMed] [Google Scholar]
- Bading H, Ginty DD, Greenberg ME. Regulation of gene expression in hippocampal neurons by distinct calcium signaling pathways. Science. 1993;260:181–186. doi: 10.1126/science.8097060. [DOI] [PubMed] [Google Scholar]
- Barbour B, Isope P. Combining loose cell-attached stimulation and recording. J Neurosci Methods. 2000;103:199–208. doi: 10.1016/s0165-0270(00)00318-6. [DOI] [PubMed] [Google Scholar]
- Barmack NH. Central vestibular system: vestibular nuclei and posterior cerebellum. Brain Res Bull. 2003;60:511–541. doi: 10.1016/s0361-9230(03)00055-8. [DOI] [PubMed] [Google Scholar]
- Berkefeld H, Sailer CA, Bildl W, Rohde W, Thumfart JO, Eble S, Klugbauer N, Reisinger E, Bischofberger J, Oliver D, Knaus HG, Schulte U, Fakler B. BKCa-Cav channels complexes mediate rapid and localized Ca2+-activated K+ signalling. Science. 2006;314:615–620. doi: 10.1126/science.1132915. [DOI] [PubMed] [Google Scholar]
- Brandt A, Striessnig J, Moser T. CaV1.3 channels are essential for development and presynaptic activity of cochlear inner hair cells. J Neurosci. 2003;23:10832–10840. doi: 10.1523/JNEUROSCI.23-34-10832.2003. [DOI] [PMC free article] [PubMed] [Google Scholar]
- Chadderton P, Margrie TW, Hausser M. Integration of quanta in cerebellar granule cells during sensory processing. Nature. 2004;428:856–860. doi: 10.1038/nature02442. [DOI] [PubMed] [Google Scholar]
- Christophe E, Doerflingler N, Lavery DJ, Molnar Z, Charpak S, Audinat E. Two populations of layer v pyramidal cells of the mouse neocortex: development and sensitivity to anesthetics. J Neurophysiol. 2005;94:3357–3367. doi: 10.1152/jn.00076.2005. [DOI] [PubMed] [Google Scholar]
- Crunelli V, Lightowler S, Pollard CE. A T-type Ca2+ current underlies low-threshold Ca2+ potentials in cells of the cat and rat lateral geniculate nucleus. J Physiol (Lond) 1989;413:543–561. doi: 10.1113/jphysiol.1989.sp017668. [DOI] [PMC free article] [PubMed] [Google Scholar]
- Crunelli V, Toth TI, Cope DW, Blethyn K, Hugues SW. The “window” T-type calcium current in brain dynamics of different behavioural states. J Physiol (Lond) 2005;562:121–129. doi: 10.1113/jphysiol.2004.076273. [DOI] [PMC free article] [PubMed] [Google Scholar]
- D'Angelo E, Nieus T, Maffei A, Armano S, Rossi P, Taglietti V, Fontana A, Naldi G. Theta-frequency bursting and resonance in cerebellar granule cells: experimental evidence and modeling of a slow K+-dependent mechanism. J Neurosci. 2001;21:759–770. doi: 10.1523/JNEUROSCI.21-03-00759.2001. [DOI] [PMC free article] [PubMed] [Google Scholar]
- Destexhe A, Sejnowski TJ. New York: Oxford UP; 2001. Thalamocortical assemblies: how ion channels, single neurons, and large-scale networks organize sleep oscillations. [Google Scholar]
- Dugué GP, Dumoulin A, Triller A, Dieudonne S. Target-dependent use of co-released inhibitory transmitters at central synapses. J Neurosci. 2005;25:6490–6498. doi: 10.1523/JNEUROSCI.1500-05.2005. [DOI] [PMC free article] [PubMed] [Google Scholar]
- Fernandez C, Goldberg JM. Physiology of peripheral neurons innervating semicircular canals of the squirrel monkey. II. Response to sinusoidal stimulation and dynamics of peripheral vestibular system. J Neurophysiol. 1971;34:661–675. doi: 10.1152/jn.1971.34.4.661. [DOI] [PubMed] [Google Scholar]
- Floris A, Dunn ME, Berrebi AS, Jacobowitz DM, Mugnaini E. The unipolar brush cells of the rat cerebellar cortex and cochlear nucleus are calretinin positive: a study by light and electron microscopy. Anat Embryol. 1994;189:495–520. doi: 10.1007/BF00186824. [DOI] [PubMed] [Google Scholar]
- Goldberg JM, Fernandez C. Physiology of peripheral neurons innervating semicircular canals of the squirrel monkey. I. Resting discharge and response to constant angular accelerations. J Neurophysiol. 1971;34:635–660. doi: 10.1152/jn.1971.34.4.635. [DOI] [PubMed] [Google Scholar]
- Habermann CJ, O'Brien BJ, Wassle H, Protti DA. AII amacrine cells express L-type calcium channels at their output synapses. J Neurosci. 2003;23:6904–6913. doi: 10.1523/JNEUROSCI.23-17-06904.2003. [DOI] [PMC free article] [PubMed] [Google Scholar]
- Helton TD, Xu W, Lipscombe D. Neuronal L-type calcium channels open quickly and are inhibited slowly. J Neurosci. 2005;25:10247–10251. doi: 10.1523/JNEUROSCI.1089-05.2005. [DOI] [PMC free article] [PubMed] [Google Scholar]
- Hering J, Feltz A, Lambert RC. Slow inactivation of the Ca(V)3.1 isotype of T-type calcium channels. J Physiol (Lond) 2004;555:331–344. doi: 10.1113/jphysiol.2003.054361. [DOI] [PMC free article] [PubMed] [Google Scholar]
- Hoogland TM, Saggau P. Facilitation of L-type Ca2+ channels in dendritic spines by activation of β2 adrenergic receptors. J Neurosci. 2004;24:8416–8427. doi: 10.1523/JNEUROSCI.1677-04.2004. [DOI] [PMC free article] [PubMed] [Google Scholar]
- Huguenard JR. Low-threshold Ca2+ currents in central nervous system neurons. Annu Rev Physiol. 1996;58:329–348. doi: 10.1146/annurev.ph.58.030196.001553. [DOI] [PubMed] [Google Scholar]
- Iftinca M, McKay BE, Snutch TP, McRory JE, Turner RW, Zampoin GW. Temperature dependence of T-type calcium channel gating. Neuroscience. 2006;142:1031–1042. doi: 10.1016/j.neuroscience.2006.07.010. [DOI] [PubMed] [Google Scholar]
- Jaarsma D, Wenthold RJ, Mugnaini E. Glutamate receptor subunits at mossy fibre-unipolar brush cell synapses: light and electron microscopic immunocytochemical study in cerebellar cortex of rat and cat. J Comp Neurol. 1995;357:145–160. doi: 10.1002/cne.903570113. [DOI] [PubMed] [Google Scholar]
- Kim D, Song I, Keum S, Lee T, Jeong MJ, Kim SS, McEnery MW, Shin HS. Lack of the burst firing of thalamocortical relay neurons and resistance to absence seizures in mice lacking α1G T-type Ca2+ channels. Neuron. 2001;31:35–45. doi: 10.1016/s0896-6273(01)00343-9. [DOI] [PubMed] [Google Scholar]
- Kinney GA, Overstreet LS, Slater NT. Prolonged physiological entrapment of glutamate in the synaptic cleft of cerebellar unipolar brush cells. J Neurophysiol. 1997;78:1320–1333. doi: 10.1152/jn.1997.78.3.1320. [DOI] [PubMed] [Google Scholar]
- Koschak A, Reimer D, Walter D, Hoda JC, Heinzle T, Grabner M, Striessnig J. Cav1.4α1 subunits can form slowly inactivating dihydropyridine-sensitive L-type Ca2+ channels lacking Ca2+-dependent inactivation. J Neurosci. 2003;23:6041–6049. doi: 10.1523/JNEUROSCI.23-14-06041.2003. [DOI] [PMC free article] [PubMed] [Google Scholar]
- Krahe R, Gabbiani F. Burst firing in sensory systems. Nat Rev Neurosci. 2004;5:13–23. doi: 10.1038/nrn1296. [DOI] [PubMed] [Google Scholar]
- Lee JH, Gomora JC, Cribbs LL, Perez-Reyes E. Nickel block of three cloned T-type calcium channels: low concentrations selectively block alpha1H. Biophys J. 1999;77:3034–3042. doi: 10.1016/S0006-3495(99)77134-1. [DOI] [PMC free article] [PubMed] [Google Scholar]
- Liu Z, Ren J, Murphy TH. Decoding of synaptic voltage waveforms by specific classes of recombinant high-threshold Ca(2+) channels. J Physiol (Lond) 2003;553:473–488. doi: 10.1113/jphysiol.2003.051110. [DOI] [PMC free article] [PubMed] [Google Scholar]
- Llinas R, Jahnsen H. Electrophysiology of mammalian thalamic neurones in vitro. Nature. 1982;297:406–408. doi: 10.1038/297406a0. [DOI] [PubMed] [Google Scholar]
- London M, Häusser M. Dendritic computation. Annu Rev Neurosci. 2005;28:503–532. doi: 10.1146/annurev.neuro.28.061604.135703. [DOI] [PubMed] [Google Scholar]
- Mainen ZF, Sejnowski TJ. Influence of dendritic structure on firing pattern in model neocortical neurons. Nature. 1996;382:363–366. doi: 10.1038/382363a0. [DOI] [PubMed] [Google Scholar]
- Malinow R, Malenka RC. AMPA receptor trafficking and synaptic plasticity. Annu Rev Neurosci. 2002;25:103–126. doi: 10.1146/annurev.neuro.25.112701.142758. [DOI] [PubMed] [Google Scholar]
- McDonough SI, Bean BP. Mibefradil inhibition of T-type Ca2+ channels in cerebellar Purkinje neurons. Mol Pharmacol. 1998;54:1080–1087. doi: 10.1124/mol.54.6.1080. [DOI] [PubMed] [Google Scholar]
- McRory JE, Hamid J, Doering CJ, Garcia E, Parker R, Hamming K, Chen L, Hildebrand M, Beedle AM, Feldcamp L, Zamponi GW, Snutch TP. The CACNA1F gene encodes an L-type calcium channel with unique biophysical properties and tissue distribution. J Neurosci. 2004;24:1707–1718. doi: 10.1523/JNEUROSCI.4846-03.2004. [DOI] [PMC free article] [PubMed] [Google Scholar]
- Mugnaini E, Dino MR, Jaarsma D. The unipolar brush cells of the mammalian cerebellum and cochlear nucleus: cytology and microcircuitry. Prog Brain Res. 1997;114:131–150. doi: 10.1016/s0079-6123(08)63362-2. [DOI] [PubMed] [Google Scholar]
- Nelson AB, Krispel CM, Sekirnjak C, du Lac S. Long-lasting increases in intrinsic excitability triggered by inhibition. Neuron. 2003;40:609–620. doi: 10.1016/s0896-6273(03)00641-x. [DOI] [PubMed] [Google Scholar]
- Nunzi MG, Mugnaini E. Unipolar brush cell axons form a large system of intrinsic mossy fibres in the postnatal vestibulocerebellum. J Comp Neurol. 2000;422:55–65. doi: 10.1002/(sici)1096-9861(20000619)422:1<55::aid-cne4>3.0.co;2-9. [DOI] [PubMed] [Google Scholar]
- Nunzi MG, Birnstiel S, Bhattacharyya BJ, Slater NT, Mugnaini E. Unipolar brush cells form a glutamatergic projection system within the mouse cerebellar cortex. J Comp Neurol. 2001;434:329–341. doi: 10.1002/cne.1180. [DOI] [PubMed] [Google Scholar]
- Nunzi MG, Shigemoto R, Mugnaini E. Differential expression of calretinin and metabotropic glutamate receptor mGluR1alpha defines subsets of unipolar brush cells in mouse cerebellum. J Comp Neurol. 2002;451:189–199. doi: 10.1002/cne.10344. [DOI] [PubMed] [Google Scholar]
- Nunzi MG, Russo M, Mugnaini E. Vesicular glutamate transporters VGLUT1 and VGLUT2 define two subsets of unipolar brush cells in organotypic cultures of mouse vestibulocerebellum. Neuroscience. 2003;122:359–371. doi: 10.1016/s0306-4522(03)00568-2. [DOI] [PubMed] [Google Scholar]
- Perez-Reyes E. Molecular physiology of low-voltage activated T-type calcium channels. Physiol Rev. 2003;83:117–161. doi: 10.1152/physrev.00018.2002. [DOI] [PubMed] [Google Scholar]
- Platzer J, Engel J, Schrott-Fischer A, Stephan K, Bova S, Chen H, Zheng H, Striessnig J. Congenital deafness and sinoatrial node dysfunction in mice lacking class D L-type Ca2+ channels. Cell. 2000;102:89–97. doi: 10.1016/s0092-8674(00)00013-1. [DOI] [PubMed] [Google Scholar]
- Randall AD, Tsien RW. Contrasting biophysical and pharmacological properties of T-type and R-type calcium channels. Neuropharmacology. 1997;36:879–893. doi: 10.1016/s0028-3908(97)00086-5. [DOI] [PubMed] [Google Scholar]
- Roberts PD. Unipolar brush cells provide a mechanism to extend a delayed representation of cerebellar mossy fiber input. Soc Neurosci Abstr. 2004;30:536–18. [Google Scholar]
- Rossi DJ, Alford S, Mugnaini E, Slater NT. Properties of transmission at a giant glutamatergic synapse in cerebellum: the mossy fibre-unipolar brush cell synapse. J Neurophysiol. 1995;74:24–42. doi: 10.1152/jn.1995.74.1.24. [DOI] [PubMed] [Google Scholar]
- Sah P, Faber ES. Channels underlying neuronal calcium-activated potassium currents. Prog Neurobiol. 2002;66:345–353. doi: 10.1016/s0301-0082(02)00004-7. [DOI] [PubMed] [Google Scholar]
- Salomé R, Kremer Y, Dieudonne S, Leger JF, Krichevsky O, Wyart C, Chatenay D, Bourdieu L. Ultrafast random-access scanning in two-photon microscopy using acousto-optic deflectors. J Neurosci Methods. 2006;154:161–174. doi: 10.1016/j.jneumeth.2005.12.010. [DOI] [PubMed] [Google Scholar]
- Sekerkova G, Ilijic E, Mugnaini E. Time of origin of unipolar brush cells in the rat cerebellum as observed by prenatal bromodeoxyuridine labeling. Neuroscience. 2004;127:845–858. doi: 10.1016/j.neuroscience.2004.05.050. [DOI] [PubMed] [Google Scholar]
- Sekerkova G, Ilijic E, Mugnaini E, Baker JF. Otolith organ or semicircular canal stimulation induces c-fos expression in unipolar brush cells and granule cells of cat and squirrel monkey. Exp Brain Res. 2005;164:286–300. doi: 10.1007/s00221-005-2252-7. [DOI] [PubMed] [Google Scholar]
- Shoham S, O'Connor DH, Sarkisov DV, Wang SS. Rapid neurotransmitter uncaging in spatially defined patterns. Nat Methods. 2005;2:837–843. doi: 10.1038/nmeth793. [DOI] [PubMed] [Google Scholar]
- Simpson JI, Hulscher HC, Sabel-Goedknegt E, Ruigrok TJ. Between in and out: linking morphology and physiology of cerebellar cortical interneurons. Prog Brain Res. 2005;148:329–340. doi: 10.1016/S0079-6123(04)48026-1. [DOI] [PubMed] [Google Scholar]
- Steriade M, McCormick DA, Sejnowski TJ. Thalamocortical oscillations in the sleeping and aroused brain. Science. 1993;262:679–685. doi: 10.1126/science.8235588. [DOI] [PubMed] [Google Scholar]
- Swensen AM, Bean BP. Ionic mechanisms of burst firing in dissociated Purkinje neurons. J Neurosci. 2003;23:9650–9663. doi: 10.1523/JNEUROSCI.23-29-09650.2003. [DOI] [PMC free article] [PubMed] [Google Scholar]
- Talley EM, Cribbs LL, Lee JH, Daud A, Perez-Reyes E, Bayliss DA. Differential distribution of three members of a gene family encoding low voltage-activated (T-type) Ca2+ channels. J Neurosci. 1999;19:1895–1911. doi: 10.1523/JNEUROSCI.19-06-01895.1999. [DOI] [PMC free article] [PubMed] [Google Scholar]
- Tavalin SJ, Shepherd D, Cloues RK, Bowden SE, Marrion NV. Modulation of single channels underlying hippocampal L-type current enhancement by agonists depends on the permeant ion. J Neurophysiol. 2004;92:824–837. doi: 10.1152/jn.00700.2003. [DOI] [PubMed] [Google Scholar]
- Tottene A, Moretti A, Pietrobon D. Functional diversity of P-type and R-type calcium channels in rat cerebellar neurons. J Neurosci. 1996;16:6353–6363. doi: 10.1523/JNEUROSCI.16-20-06353.1996. [DOI] [PMC free article] [PubMed] [Google Scholar]
- Viana F, Van den Bosch L, Missiaen L, Vandenberghe W, Droogmans G, Nilius B, Robberecht W. Mibefradil (Ro 40–5967) blocks multiple types of voltage-gated Ca2+ channels in cultured rat spinal motoneurones. Cell Calcium. 1997;22:299–311. doi: 10.1016/s0143-4160(97)90068-3. [DOI] [PubMed] [Google Scholar]
- Vig J, Takacs J, Abraham H, Kovacs GG, Hamori J. Calretinin-immunoreactive unipolar brush cells in the developing human cerebellum. Int J Dev Neurosci. 2005;23:723–729. doi: 10.1016/j.ijdevneu.2005.10.002. [DOI] [PubMed] [Google Scholar]
- Xu W, Lipscombe D. Neuronal Cav1.3 L-type channels activate at relatively hyperpolarized membrane potentials and are incompletely inhibited by dihydropyridines. J Neurosci. 2001;21:5944–5951. doi: 10.1523/JNEUROSCI.21-16-05944.2001. [DOI] [PMC free article] [PubMed] [Google Scholar]
- Yasuda R, Sabatini BL, Svoboda K. Plasticity of calcium channels in dendritic spines. Nat Neurosci. 2003;6:948–955. doi: 10.1038/nn1112. [DOI] [PubMed] [Google Scholar]