
Figure 6.
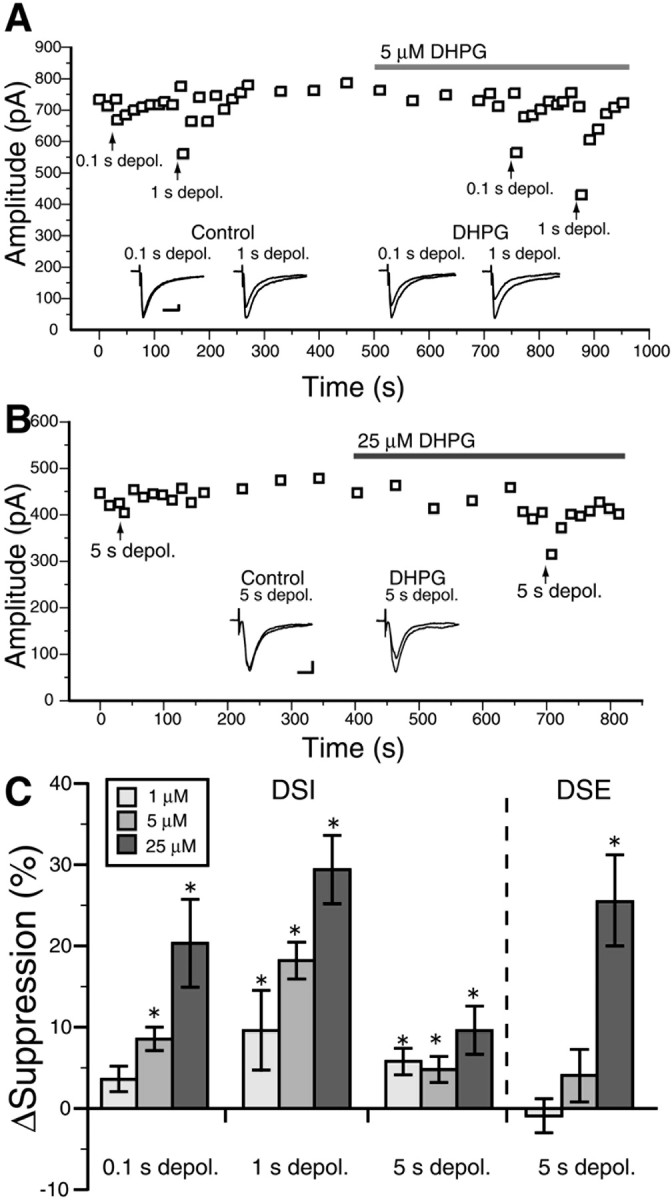
Activation of group I mGluRs causes dose-dependent enhancement of striatal DSI and DSE. A, Representative data demonstrating enhancement of DSI by 5 μm DHPG. Each point represents the average of three consecutive traces. Depolarizing pulses (depol.) with duration of 0.1 or 1 s were applied before and during DHPG application at the time points indicated with upward arrows. Inset, Sample IPSC traces showing DSI in the control external solution and in the presence of 5 μm DHPG. Calibration: 100 pA, 10 ms. B, Representative data demonstrating enhancement of DSE by 25 μm DHPG. Depolarizing pulses with 5 s duration were applied before and during DHPG application. Inset, Sample EPSC traces showing DSE before and after DHPG application. Calibration: 100 pA, 10 ms. C, Summary bar graphs showing dose-dependent enhancement of DSI and DSE by DHPG. The degree of enhancement was calculated as the change in the magnitude of DSI or DSE during DHPG application relative to the value before application (ΔSuppression).