
Figure 4.
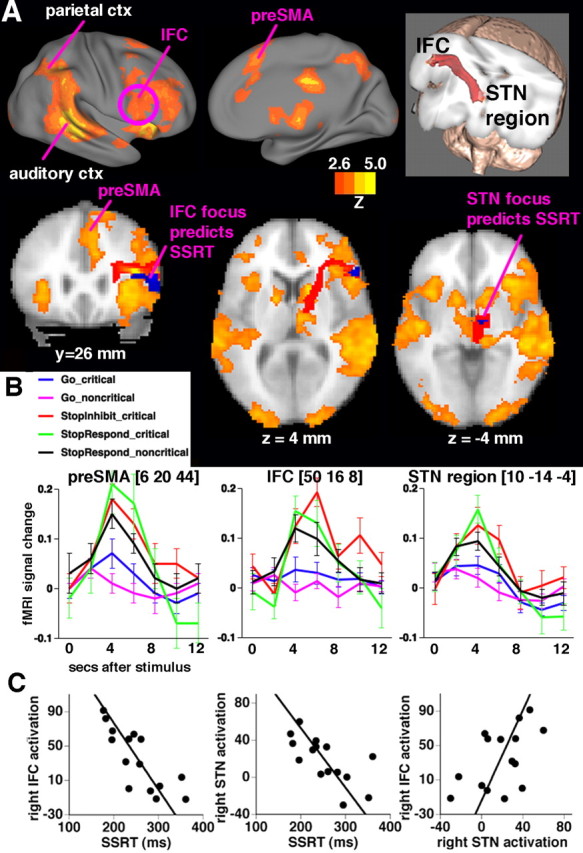
Outright response inhibition: relationships between activation, tracts, and SSRT. A, Regions of significant activation are shown for the contrast of StopInhibit − Go (in the critical direction) (Z > 2.3; p < 0.05, corrected for multiple comparisons at the whole-brain level). Right lateral and medial views, along with slices, show activation in a mainly right-lateralized network including the preSMA/anterior cingulate, the IFC, the STN region, the auditory cortex (auditory ctx; stop-signal tone), and the parietal cortex (parietal ctx). On the slices, blue regions at the IFC and the STN region denote foci where there was a significant correlation between SSRT and activation (small-volume correction for anatomically defined IFC and STN regions). The white matter tract connecting the IFC and the STN region is overlayed in red (see also top right inset). B, Mean peristimulus time courses (and SEs) extracted from each of the right preSMA, IFC, and STN regions for each event type. C, Subjects who inhibit more quickly activate the right IFC and the STN region more. SSRT was regressed against StopInhibit − Go activation in each of right IFC, preSMA and STN regions, anatomically defined, and the results were corrected for multiple comparisons. Activation was significant in the right IFC (MNI: 44, 22, 12; Z = 3.84; p < 0.05, small-volume correction) and the STN region (MNI: 14, −8, −4; Z = 3.02; p < 0.05, small-volume correction) but not in the preSMA. Mean activation was extracted from a sphere (radius, 3 mm) centered on the peak voxel. Activation of the right IFC and the right STN region was also significantly correlated across subjects (r = 0.53; p = 0.04).