
Figure 5.
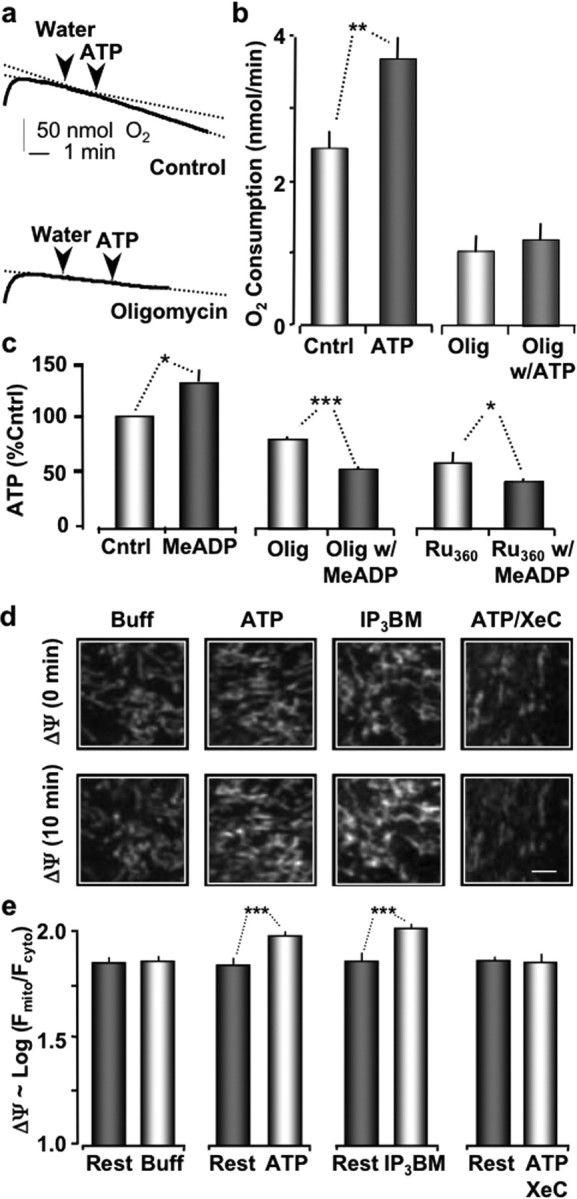
Stimulation of P2Y-Rs increases O2 consumption, ATP production, and increases ΔΨ. a, Plots of O2 levels in suspended astrocytes as labeled. b, Histogram shows the average change in O2 consumption with 2 μm ATP compared with untreated cells (Cntrl). Bars on the right show O2 consumption of astrocytes are preloaded with 0.01 μm oligomycin (30 min). c, Direct measurement of intracellular ATP levels relative to untreated cells (control), P2Y-R stimulated (MeADP), then the same measurements in the presence of oligomycin (oligo) or Ru360. d, Astrocyte mitochondria (TMRE loaded) at 0 min (top panels) and 10 min after treatments as labeled (bottom panels). e, Histogram plot showing average mitochondrial membrane potentials before and after treatment. ***p < 0.001; **p < 0.01; *p < 0.05.