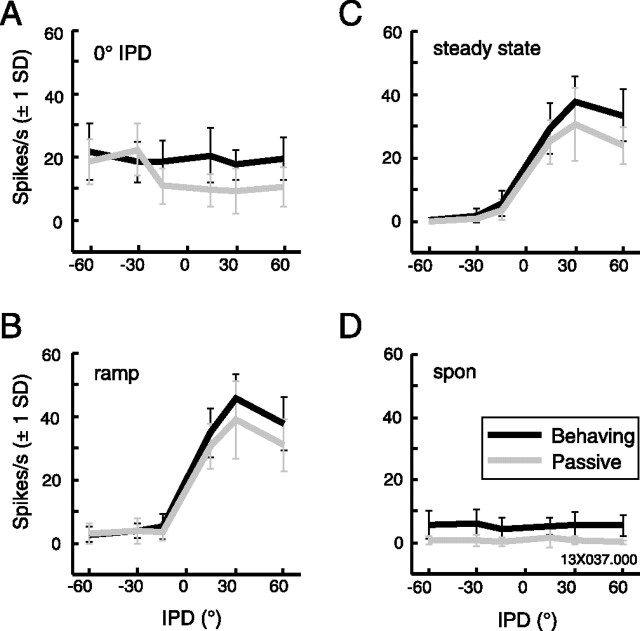
Figure 4.
Firing rate tuning to IPD was similar under behaving and passive conditions (same neuron as depicted in Fig. 3). Mean firing rates (error bars indicate ±1 SD) during the four stimulus epochs defined in Figure 3, under behaving (black) and passive (gray) conditions. A, 0° IPD onset. B, Dynamic IPD ramp. C, Steady-state IPD. D, Spontaneous (spon) rate.

