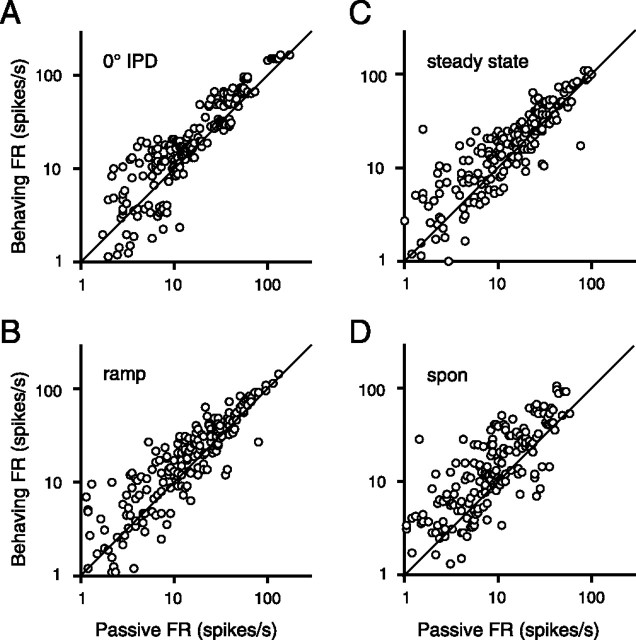
Figure 6.
Comparison of firing rates (FR) under behaving and passive conditions for the full population of equivalent stimuli (each cell contributes multiple points). Points above the line of unity indicate an elevated firing rate during behavior. All four epochs show a significant shift by a paired t test (p < 0.0001). A, 0° IPD onset. B, Dynamic IPD ramp. C, Steady-state IPD. D, Spontaneous (spon) rate.

