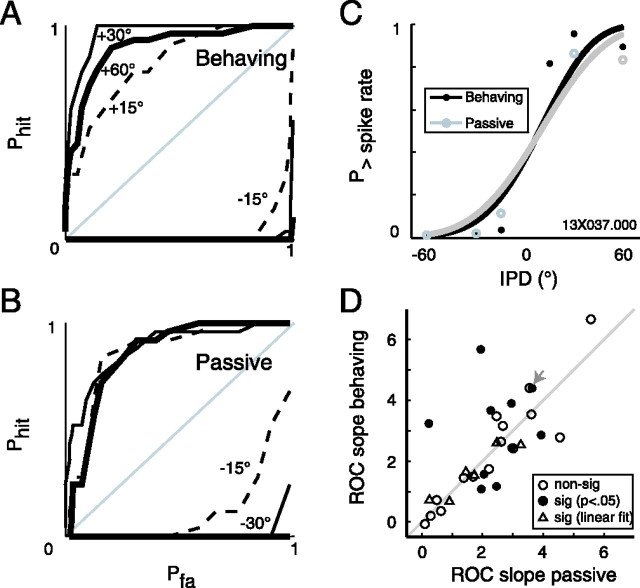
Figure 7.
ROC analysis reveals comparable neural tuning to IPD between behavioral conditions. A–C, ROC curves at each IPD value under behaving (A) and passive (B) conditions are integrated to generate the sigmoid neurometric functions in C (same neuron as depicted in Figs. 3 and 4). Curves in C are fit with two-parameter Weibull distributions; the difference in slope between behaving (black curve) and passive (gray curve) conditions was significant by a bootstrap simulation. D, Function slopes are compared between conditions (overall difference for the population: p = 0.77, Wilcoxon sign-rank). Filled circles, differences in slope significant (p < 0.05) by bootstrap simulation; open circles, p ≥ 0.05; open triangles, difference is significant by a linear fit only. The gray arrow marks the neuron from C. non-sig, Nonsignificant; sig, significant.

