
Figure 8.
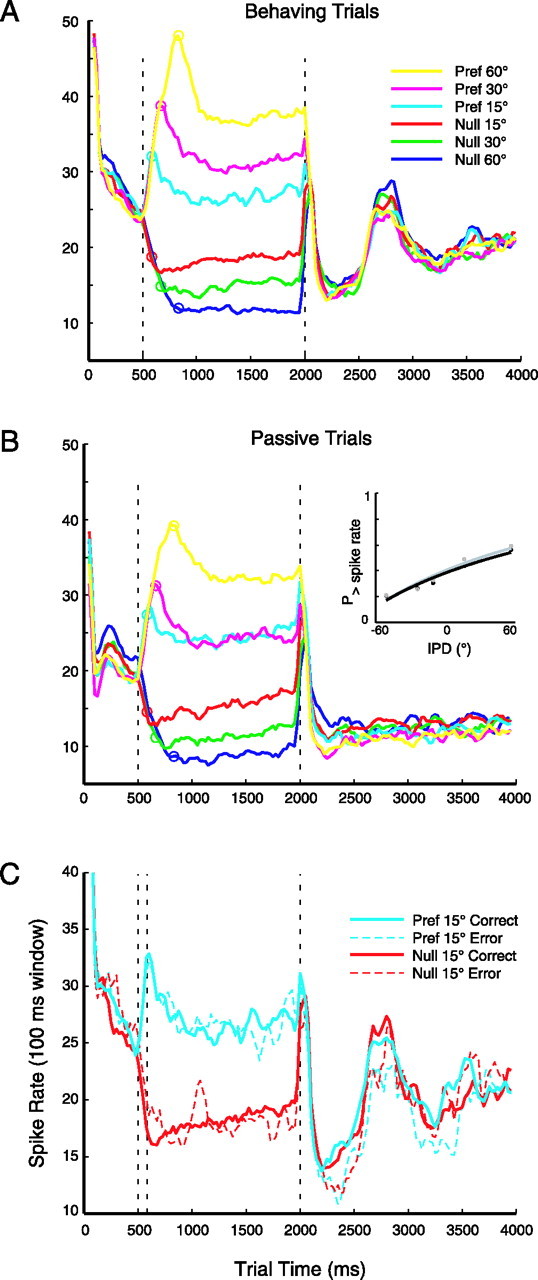
Average discharge rate for the population tracked IPD through the trial but did not reliably predict errors in behavioral response. A, Discharge rate in a 100 ms sliding window (in 25 ms steps), for trials under the behaving condition, sorted by magnitude and direction of IPD shift from blue (60° in the null direction) to yellow (60° in the preferred direction). The hemifield contralateral to the recording site was preferred in 22 of 31 neurons. The dashed line at 500 ms marks the beginning of the dynamic IPD ramp, open circles mark the end of the ramp and the beginning of the steady-state IPD, and the dashed line at 2000 ms marks the offset of the stimulus. B, Trials during passive stimulation (stimuli presented in blocks), same conventions as in A. Inset, Neurometric functions for the pooled population data, with statistically identical slopes between the behaving (black) and passive (gray) conditions (axes as in Fig. 7C). C, Discharge rate during behavior on ±15° trials, separated into correct (solid lines) and error (dashed lines) responses. From left to right, vertical dashed lines represent the beginning and end of the IPD ramp and the offset of the stimulus. n = 1245 correct and 528 error trials, in 31 neurons. Pref, Preferred.