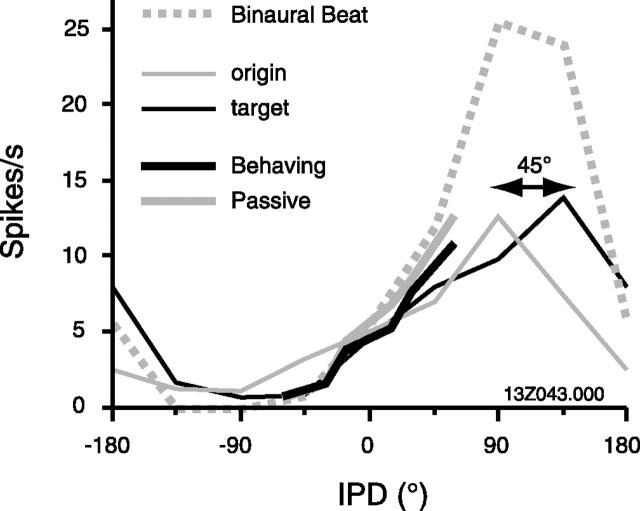
Figure 9.
Behavior effects on tuning curves are small, relative to tuning shifts induced by stimulus context. Tuning to IPD during passive listening is influenced by the preceding stimulus, in this case a positive (origin, thin gray line) or negative (target, thin black line) 90° phase shift (Malone et al., 2002). The computed phase shift between these functions is 45°. Thick black and gray lines indicate steady-state responses under behaving and passive conditions, respectively. The thick dashed gray line indicates spike rate in response to a binaural beat [500 ms cycle, divided into 62.5 ms bins centered at the same 8 IPD values used by Malone et al. (2002)].

