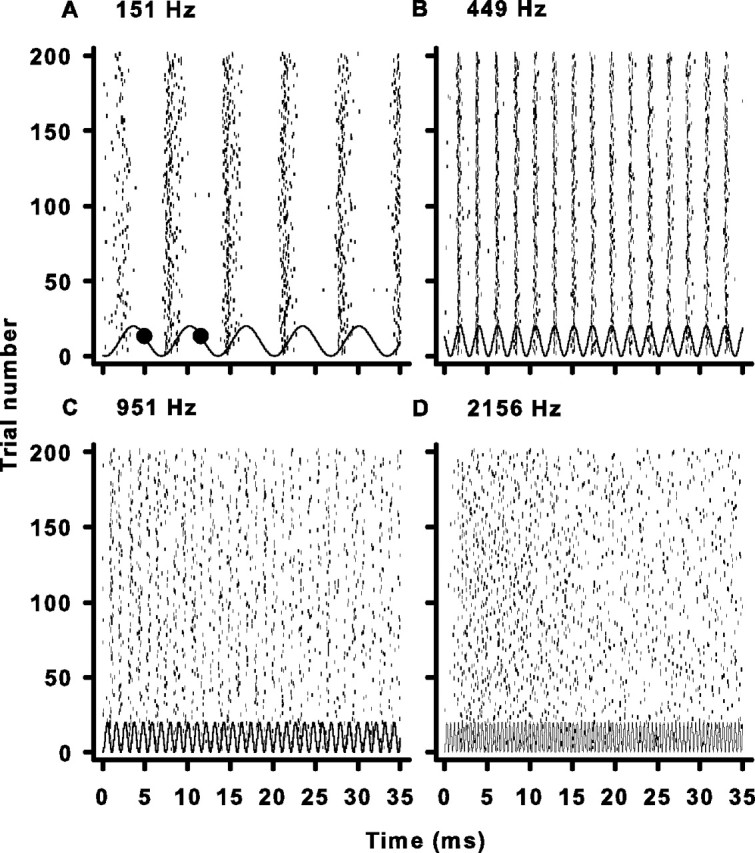
Figure 1.

Examples of cochlear nerve responses to pure tones. A, Raster plot of the response of a single unit to multiple presentations of a pure tone at CF. The small dark ticks represent occurrences of spikes. The solid wavy line represents the pressure waveform of the pure tone stimulus at the tympanic membrane. The large black circles are the boundaries of the first event in the response (see Materials and Methods). The number at the top left of each panel is the CF and stimulus frequency. B–D, Same as A but for cells with progressively higher CFs.
