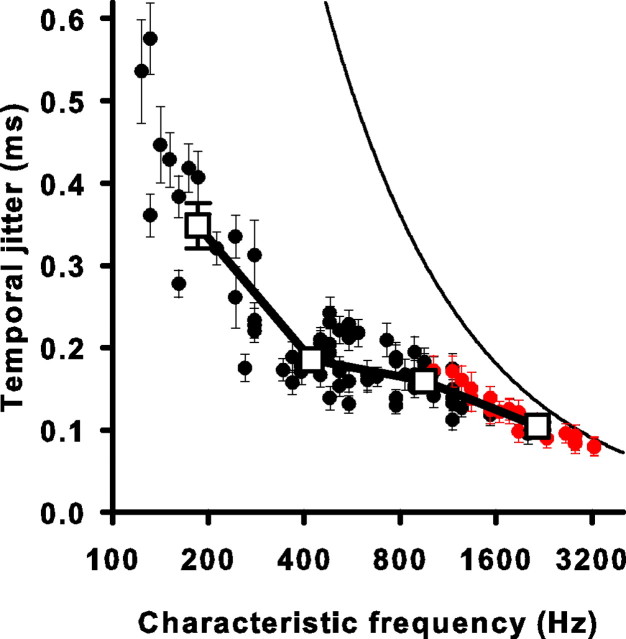
Figure 3.
Spike-timing precision improves with higher CF. The mean temporal jitter of all events is plotted for each cell as a function of CF (circles). Error bars are the average SD of the temporal jitter estimate as determined by a bootstrap procedure (see Materials and Methods). Red circles represent units for which >5% of events had temporal jitters that could have been generated by an unsynchronized event with 5% probability, as tested by a Monte Carlo simulation (see Materials and Methods). Open squares represent averaged data for four logarithmically spaced frequency ranges. Error bars are the SEs of the mean. The solid curved line is the temporal jitter expected for an unsynchronized event resulting from using an analysis window that is one stimulus cycle long. It is equal to the square root of 1/12 divided by the CF (for derivation, see Materials and Methods).

