Figure 7.

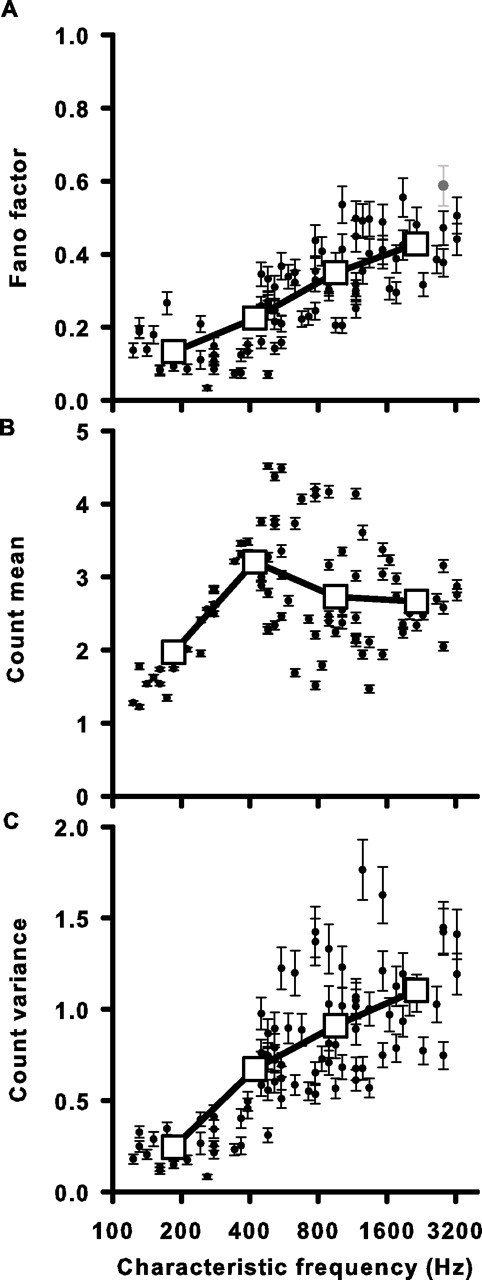
Spike-count reliability decreases with higher CF. A, The mean Fano factor (spike-count variance/mean) for each unit plotted against CF. Filled circles are the average FF for all 10 ms windows in the cell's response. The single gray circle is a unit for which >5% of the 10 ms windows had measured FF values that did not vary significantly from an FF generated by a Poisson process with the same instantaneous firing rate function. This was tested using a Monte Carlo simulation (see Materials and Methods). B, Spike-count mean as a function of CF. C, Spike-count variance as a function of CF. Error bars represent the average SD of the count mean, variance, and FF for all 10 ms windows in the cell's response as determined by a bootstrap procedure (see Materials and Methods). Large open squares represent the data binned into four frequency ranges and averaged (same ranges as Fig. 6). The SEM is smaller than the square symbol size in all cases.
