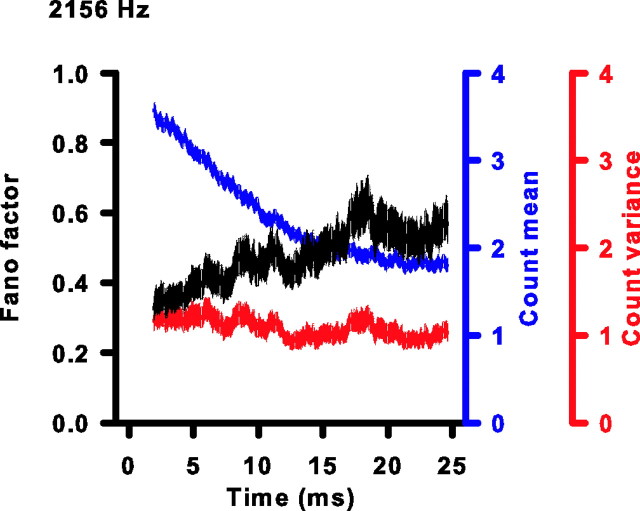
Figure 8.
FF increases during short-term adaptation. The Fano factor (black), spike-count mean (blue), and spike-count variance (red) plotted as a function of duration of stimulation for the same cell as in Figure 1D. The thickness of each curve is the SD of the estimated parameter at each time as determined by a bootstrap procedure (see Materials and Methods). The number at the top left of the figure is the CF and stimulus frequency.

