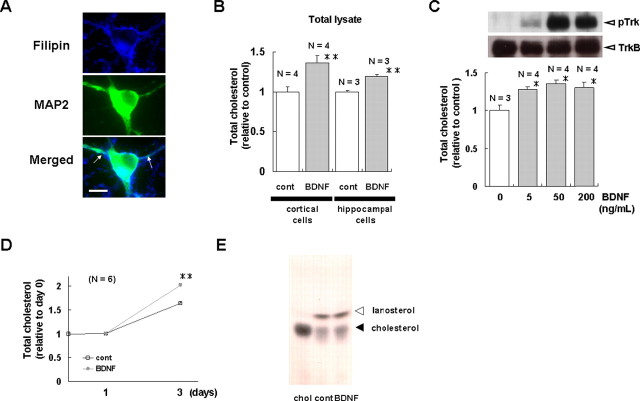
Figure 1.
BDNF elicits cholesterol biosynthesis in cultured cortical and hippocampal neurons. Cholesterol content of cortical and hippocampal cells cultured under various conditions was measured. A, Cholesterol in cultured cortical neurons was shown by staining cells with filipin, as described previously (Ma et al., 2003). Scale bar, 10 μm. B, Cortical and hippocampal cells were cultured in the presence or absence of 200 ng/ml BDNF for 3 and 5 d, respectively. Compared with untreated cells (cont), BDNF-treated cortical and hippocampal cells had higher cholesterol contents. C, BDNF increased the cholesterol content in cortical cells in a dose-dependent manner. Top, The TrkB receptor was activated by BDNF in a dose-dependent manner. Cell lysates were collected before or 3 min after treatment with the indicated concentration of BDNF. Immunoblotting was performed with anti-TrkB and anti-phospho-Trk antibodies, as described previously (Suzuki et al., 2004). Bottom, BDNF increased cholesterol content in a concentration-dependent manner. Cholesterol content was measured 3 d after treatment with the indicated concentration of BDNF. D, A time course study of the BDNF-dependent cholesterol increase in cortical cells. Cells were cultured in the presence or absence of BDNF (200 ng/ml) for the indicated times, and the cholesterol amount was determined. E, TLC analysis of cholesterol in BDNF-treated cortical neurons. Sterols were isolated from cortical neurons cultured in the presence or absence of BDNF (200 ng/ml) for 5 d. Extracts were dissolved in isopropyl alcohol and separated by TLC. Spots were visualized by using p-anisaldehyde. The positions of cholesterol and lanosterol are indicated with arrowheads. As a control, commercially obtained, purified cholesterol (chol) was loaded. Densitometric analysis demonstrated that the increase in cholesterol content in response to BDNF was 38 ± 12%. The value for each cholesterol band was normalized to that of the control sample. This and all other figures demonstrate that results are relative to control and are shown as the means ± SEM. Asterisks indicate a significant difference from control samples (Student's t test; *p < 0.03; **p < 0.01).

