
Figure 4.
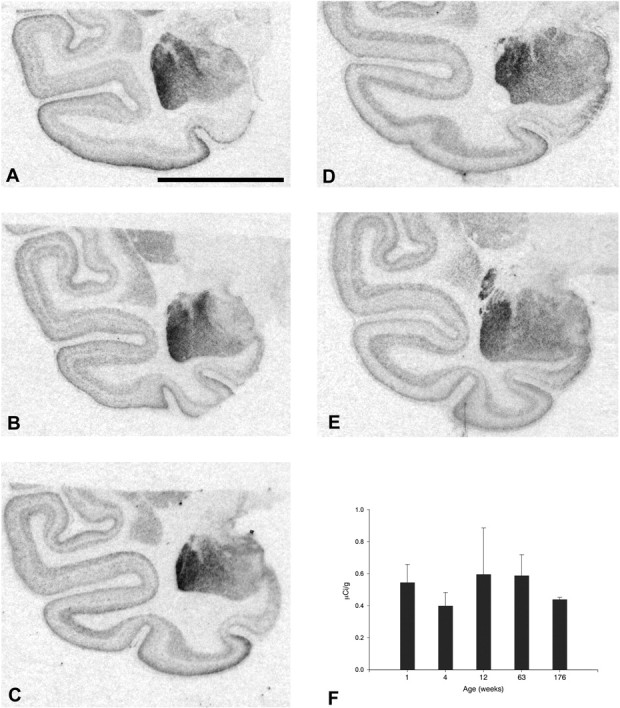
Anatomical expression of the development of GUCY1A3 mRNA expression. Images of representative scans of the radiographic films from one animal per age are as follows: A, 1 week; B, 4 weeks; C, 12 weeks; D, 63 weeks; and E, 176 weeks. Each image depicts the amygdala and surrounding cortical areas. Darker shades of gray represent high levels of GUCY1A3 mRNA expression, and lighter shades of gray represent low levels of GUCY1A3 mRNA expression. Intense labeling is present in the amygdala at all ages examined. F, Expression level in the amygdala was quantified from the radiographic OD and converted to known a known quantity of 14C standard. Each bar represents the average quantified GUCY1A3 mRNA level from three to six animals per age. Error bars represent 1 SD. There was no significant difference between any of the ages examined (F (4,15) = 0.937; p = 0.469). Scale bar, 10 mm.