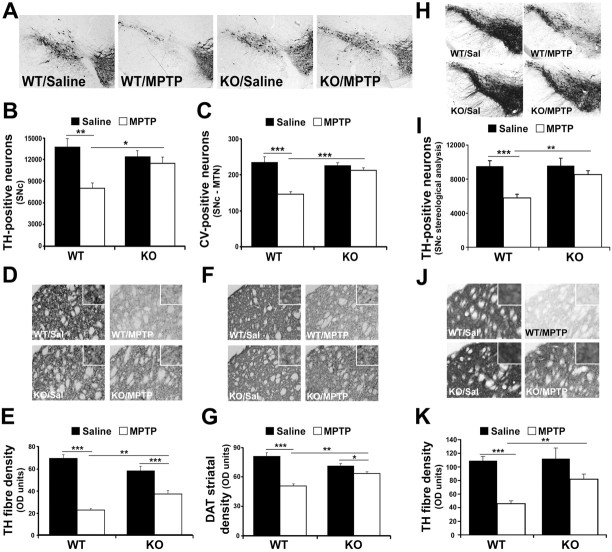
Figure 2.
IFN-γ-deficient mice display protection of dopaminergic cell bodies and striatal terminals of MPTP-induced degeneration of SNc dopaminergic neurons. A, Representative photomicrographs illustrating TH immunoreactivity in the ventral midbrain SNc of the indicated non-littermate treatment groups, as indicated in Materials and Methods. B, Quantification of TH+ neurons using Abercrombie correction, as described in Materials and Methods. C, Quantification of cresyl violet-stained cells of the SNc (MTN level). D, Representative photomicrographs of striatal sections stained with TH from the animal groups as described in A. Magnified images are included in the insets of D–J. E, Quantification of optical density of TH striatal fibers. F, Representative photomicrographs illustrating DAT immunoreactivity in the striatum of indicated treatment groups as in A. G, Quantification of optical density of striatal DAT-stained fiber density. H, Representative photomicrographs illustrating TH immunoreactivity in the SNc of the indicated littermate treatment animal groups. Staining is more intense here than in A because of increased section thickness required for stereological analyses. I, Quantification of TH+ neurons, in littermate animals by stereology, as described in Materials and Methods. J, Representative photomicrographs of striatal TH fiber density of indicated littermate treatment groups. K, Quantification of OD of striatal TH-stained fiber density of indicated littermates. Error bars represent mean ± SEM. ANOVA, *p < 0.05, **p < 0.01, ***p < 0.001; n = 6–8 animals per group. OD, Optical density; Sal, saline.

