
Figure 3.
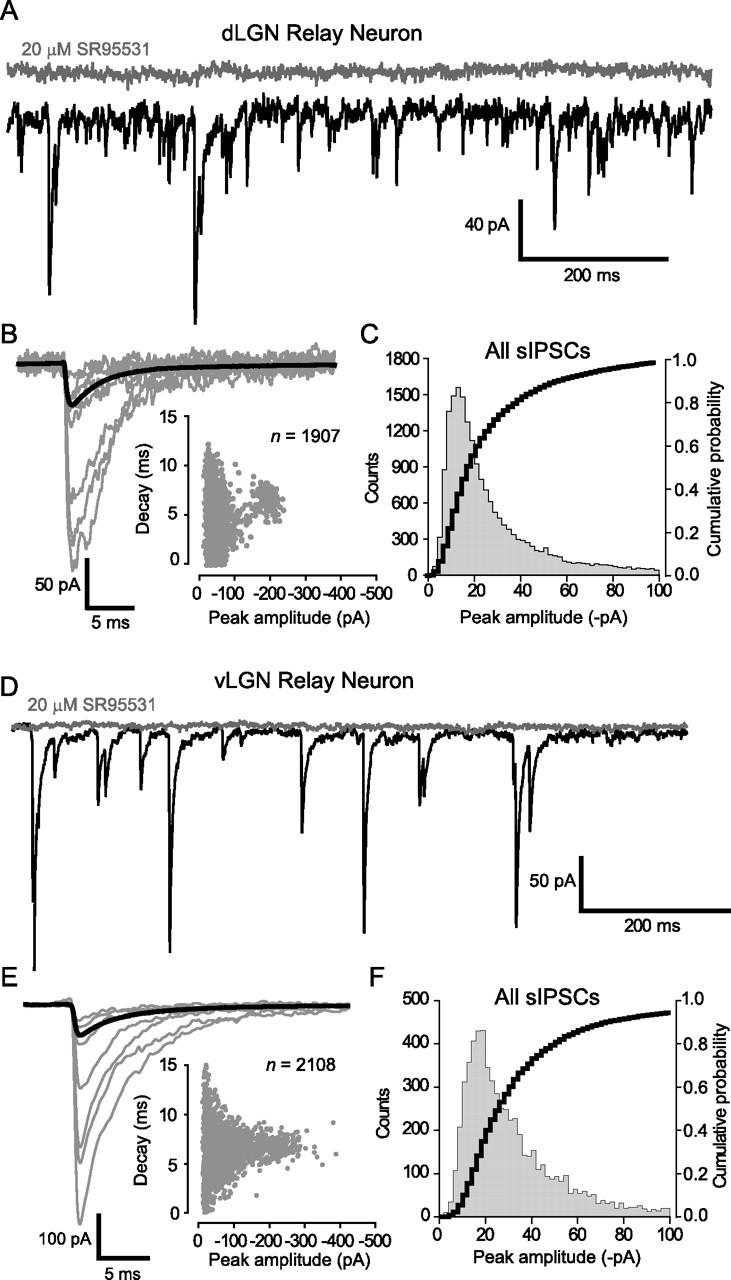
IPSC kinetics are not affected by the presence of δ-GABAARs. A, D, Continuous current traces from a dLGN relay neuron (A) and a vLGN relay neuron (D) before (black trace) and after (gray trace) the application of SR-95531 (20 μm). B, E, Examples of the smallest and largest detected sIPSCs are shown with the average waveform for these cells shown in bold [dLGN neuron (B); vLGN neuron (E)]. Insets, Plots of peak amplitude against decay time, demonstrating the presence of small and large sIPSCs with similar decay kinetics in each relay neuron. Note how the vLGN relay neuron has a greater proportion of large-amplitude sIPSCs. C, F, All point histogram and cumulative probability plot of sIPSC peak amplitudes recorded from all dLGN (n = 39; C) and vLGN (n = 17; F) relay neurons. In these graphs, we have restricted the abscissa to a maximum of 100 pA to illustrate the similar distribution of small-amplitude sIPSCs within dLGN and vLGN relay neurons.