
Figure 2.
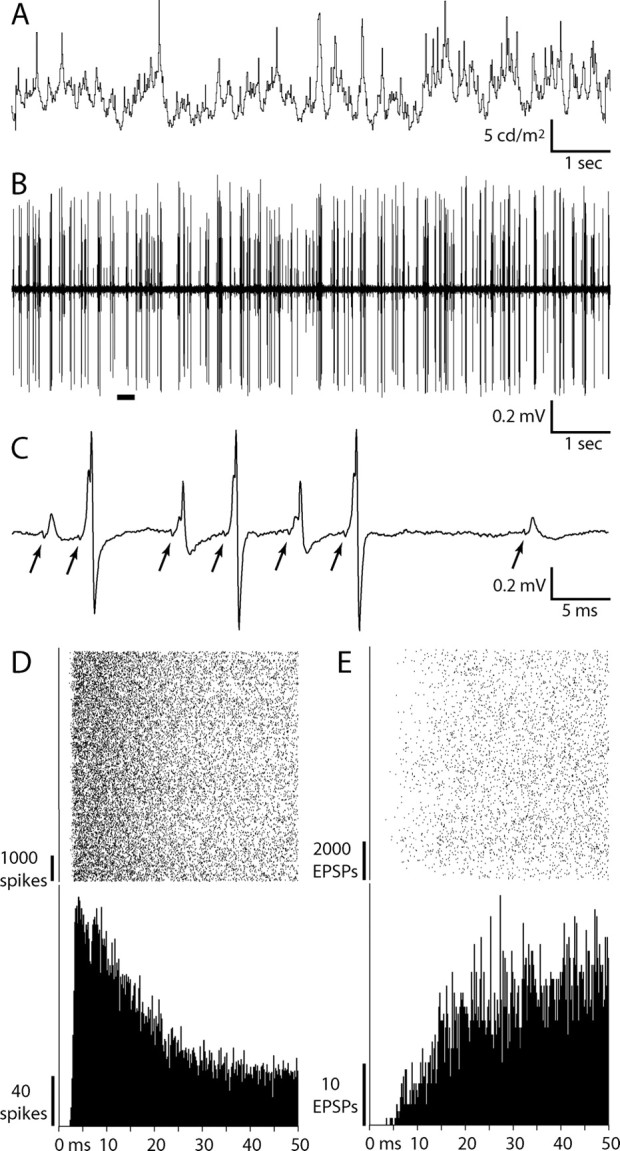
LGN action potentials and EPSPs recorded during visual stimulation. A, Luminance modulation of a ½° spot of light centered on the receptive field of an ON magnocellular neuron (mean luminance, 6.1 cd/m2). B, Raw electrode trace acquired during this 10 s stimulus epoch. C, Expanded trace of the underlined portion in B, illustrating the occurrence of retinal EPSPs associated with LGN spikes. EPSPs that occur at the beginning of the largest spikes are often difficult to identify because the waveforms are partially merged. The miniscule deflection (“T-potential”) in front of each EPSP (arrows) arises from the retinal action potential invading the axon terminals (Wang et al., 1985), providing independent evidence that an EPSP precedes each LGN spike. D, Spike rasters aligned on each axon initial segment potential (top) and resulting interspike interval histogram (bottom; n = 9044). This LGN neuron had an absolute refractory period of 2.5 ms. E, Rasters and interval histogram for isolated EPSPs, not associated with LGN spikes, compiled over the same time period as in D (n = 11,873). The isolated EPSPs had a refractory period of 3.5 ms.