
Figure 6.
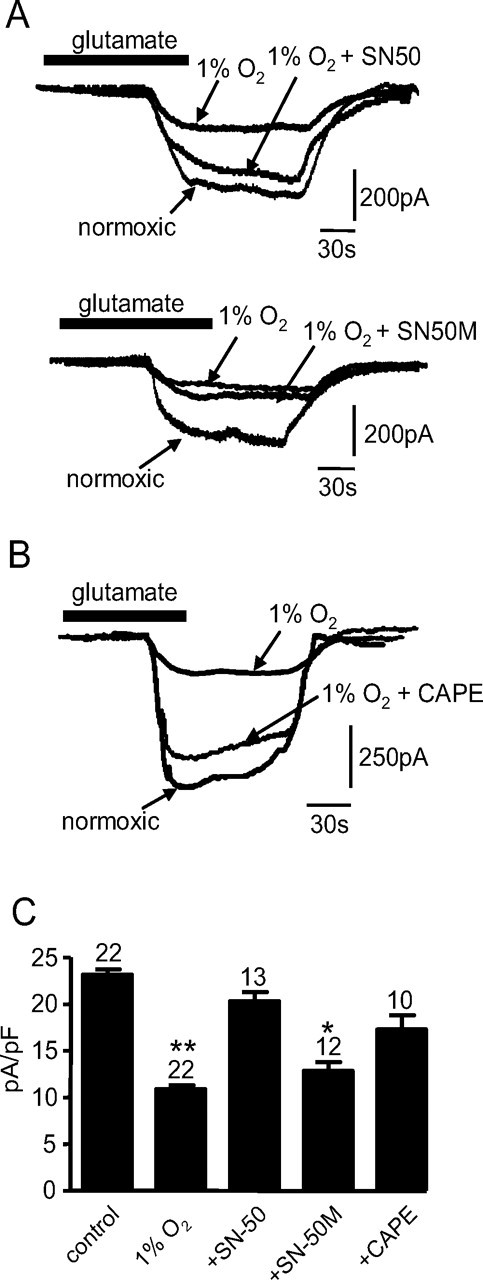
A, Top traces, Superimposed example inward currents evoked by exposure of astrocytes to 10 μm l-glutamate (applied for the period indicated by the horizontal bar). Cells were either cultured normoxically, or in 1% O2 in the absence or presence of 5 μm SN50, as indicated. Calibration applies to all traces. Bottom traces, As top, except that the inactive SN50 analog, SN50M (5 μm), was present for the experiment indicated. B, Superimposed example inward currents evoked by exposure of astrocytes to 10 μm l-glutamate as in A, except that hypoxic cells were cultured in the absence or presence of 10 μm CAPE. C, Mean (with SEM error bars taken from number of cells indicated above each bar) current densities evoked by glutamate in cells cultured under conditions indicated in A and B. *p < 0.05; **p < 0.01.