
Figure 7.
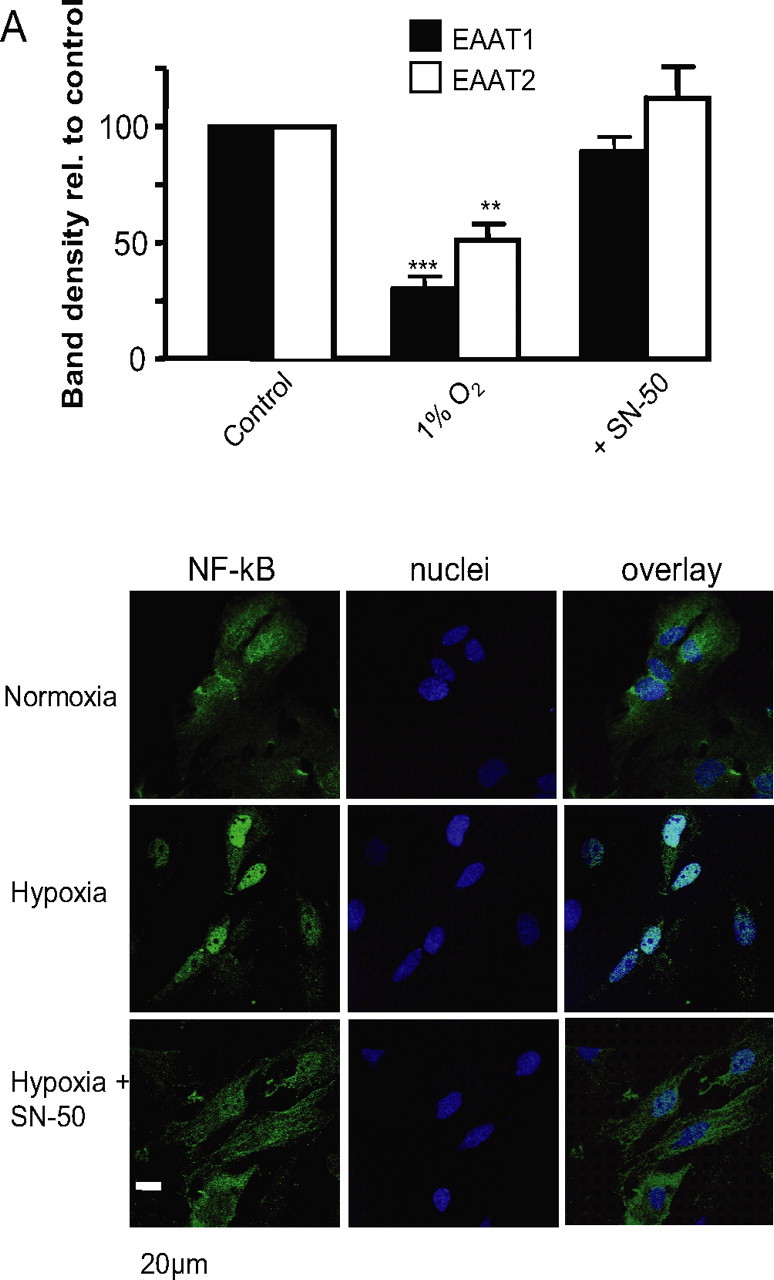
A, Relative band densities (percentage of control normoxic densities) for EAAT1 and EAAT2 in Western blots of extracts from cells cultured in normoxia, 1% O2 and 1% O2 in the additional presence of 5 μm SN50. Each bar is the mean ± SEM taken from three separate blots. **p < 0.01; ***p < 0.001. B, Representative example images of astrocytes immunostained for NF-κB (green; left traces) and also stained with the nuclear dye DAPI (blue; middle traces). Overlaid images are shown on the right. Cells were cultured either normoxically (top images) or in 1% O2 in the absence (middle traces) or presence (bottom traces) of 5 μm SN50. Scale bar applies to all images.