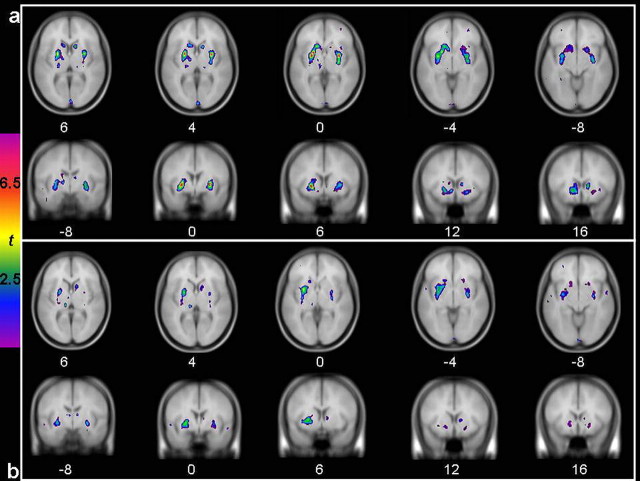
Figure 1.
t statistical maps of [11C]raclopride BP change illustrating decreased [11C]raclopride BP after the single-dose amphetamine administration (A) (0.3 mg/kg, p.o.) and the placebo administration (B) relative to the control condition. Colored t maps are overlaid on an average T1 MRI of all participants.

