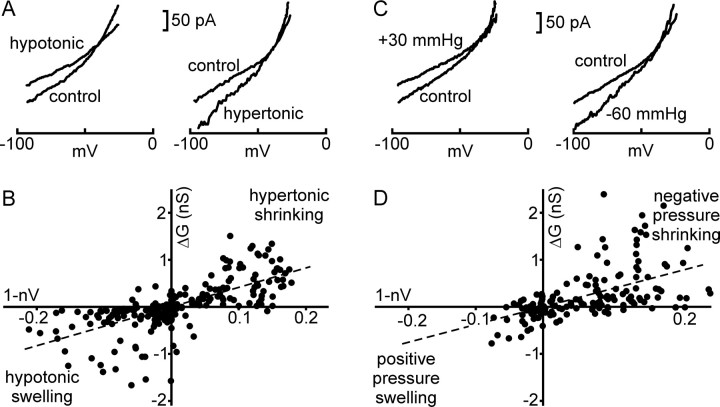
Figure 1.
Volume modulation of cation current by osmotic and hydrostatic pressure. A, Steady-state I–V relationships measured from isolated MNCs (VH = −70 mV) exposed to hypotonic (left) and hypertonic solutions (right). Note that the stimuli respectively reduce and increase slope conductance. B, Relationships between changes in slope conductance (ΔG) and volume decrease (1 − nV) during osmotic stimulation. Each point depicts simultaneous measures of ΔG and 1 − nV taken at several time points during hypotonic (bottom left quadrant) or hypertonic stimuli (top right quadrant). Solid line is a linear regression fit of the data (slope = 4.1 nS/nΔV; n = 22; r = 0.6847). C, Steady-state I–V relationships measured from cells inflated by positive pressure in the patch pipette (left) and shrunken by negative pressure (right). Note that the stimuli respectively reduce and increase slope conductance. D, Relationship between ΔG and 1 − nV during pressure-evoked responses. Points depict simultaneous measures of ΔG and 1 − nV taken at various times during application of positive pressure (bottom left quadrant) or negative pressure (top right quadrant). The solid line is a linear regression fit of the data (slope = 3.9 nS/nΔV; r = 0.602; n = 21). Mean values of the reversal potentials of the ionic currents modulated by hypo-osmolality (−36 ± 3 mV), hyperosmolality (−31 ± 4 mV), positive pressure (−33 ± 5 mV), and negative pressure (−33 ± 4 mV) were not significantly different from one another (p = 0.83; one-way ANOVA), and were consistent with the involvement of SIC channels in all of these responses. The slopes of the regression lines shown in B and D are not different (p > 0.05).

