
Figure 3.
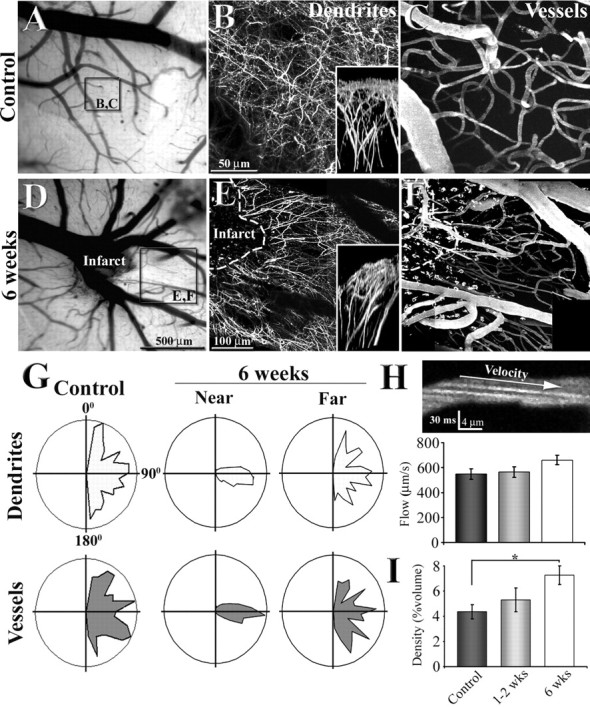
Reorganization of apical dendritic tufts and flowing vasculature in peri-infarct cortex. A, D, Low-magnification brightfield images showing the surface of the brain and vessels through the cranial window. B, C, E, F, Maximal intensity z projections of 80 planar sections (taken 2 μm apart) illustrating the organization of dendritic tufts and vasculature in a control (B, C) and 6 weeks after photothrombotic stroke (E, F). Insets in B and E show a side view of the apical dendritic tufts projected in the y–z axis. G, Polar plots showing the orientation of dendritic and vascular segments in control (n = 3) and regions near and far from the infarct border (n = 3; near, <250 μm; far, 500–800 μm). Note that 6 weeks after stroke, dendrites and vessels run in parallel with each other at a 90–100 angle in regions close to, but not further away from the infarct border. H, A sample image showing the arc created by flowing Texas Red labeled plasma (offset by negatively stained red blood cells) in the lumen of the capillary. Using the slope of these arcs to assess blood velocity, we found no significant differences in capillary blood flow velocity between control and peri-infarct regions. I, Graph showing a progressive increase in blood vessel density in peri-infarct cortex over time. *p < 0.05.